
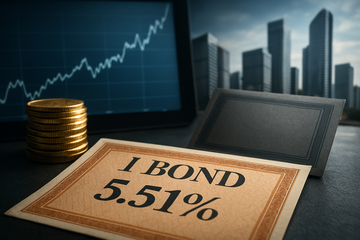
Series I composite rate
5.51%
New purchases from Nov. 1, 2026 through Apr. 30, 2027; announced Oct. 30, 2026
Locked fixed rate
1.40%
Lifted from 0.90%; fixed for the life of the bond
10-year Treasury yield
4.98%
Constant maturity, Oct. 30, 2026
Nasdaq 100 in October
−5.8%
Month to date through Oct. 30, 2026
Four hyperscalers' trailing capex
$615B
Against $61B of combined trailing free cash flow
AI-related corporate bonds
$228B+
Issued by Alphabet, Amazon, Meta and Oracle through Oct. 13, 2026
The rate reset
The 5.51% Headline Locks Only 1.40 Points — the Rest Is Consumer Prices
Treasury's Oct. 30, 2026 announcement set the Series I composite rate at 5.51% for bonds bought from Nov. 1, 2026 through Apr. 30, 2027, up from 4.26% for the May-to-October window. The headline splits into a fixed rate of 1.40%, lifted from 0.90%, and an inflation-linked component of 4.08%, so the bond locks only 1.40 of the 5.51 points in real terms for twenty years.
| Instrument | Rate | What it is | Source document |
|---|---|---|---|
| Series I composite (new purchases) | 5.51% | Fixed 1.40% plus inflation-linked 4.08%, Nov. 1, 2026 to Apr. 30, 2027 | Treasury announcement, Oct. 30, 2026 |
| Series I composite (prior window) | 4.26% | Rate paid on purchases from May 1 to Oct. 31, 2026 | Treasury announcement, Oct. 30, 2026 |
| 10-year Treasury note | 4.98% | Constant-maturity yield, Oct. 30, 2026 | Federal Reserve H.15 |
| 3-month Treasury bill | 4.00% | Secondary-market yield, Oct. 30, 2026 | Federal Reserve H.15 |
| 6-month Treasury bill | 4.15% | Secondary-market yield, Oct. 30, 2026 | Federal Reserve H.15 |
| Nasdaq 100 in October | −5.8% | Month to date through Oct. 30, 2026 | Reuters, Oct. 30, 2026 |
That split decides who should buy what. The 10-year note yielded 4.98% on Oct. 30, 2026, above the I-bond's locked real rate, because it carries market inflation expectations rather than realised ones. If the semiannual inflation rate settles near 1.00% when Treasury resets on May 1, 2027, the composite prints around 3.40% while the 1.40% real lock stays put. The 5.51% headline is a bet that inflation keeps running hot; the 1.40% is the promise.
Household economics
What a Saver Actually Keeps Depends on Where They Live, Not on the Coupon
The tax treatment matters more than the headline for many savers, and it is far less uniform than the marketing implies. Interest on savings bonds is exempt from state and local income tax, is taxed federally as ordinary income only when the bond is redeemed, and can be excluded outright for households below the income limits that use proceeds for qualified higher education — $114,500 of modified adjusted gross income for a single filer and $179,250 for a married couple filing jointly in 2025. The saver's edge depends on the state, not on the size of the balance sheet.
- State and local income tax never touches the interest, so the same 5.51% pays more to a saver in New York than to a saver in Texas.
- Federal tax is deferred rather than waived: the bill arrives at redemption, unless Form 8815 excludes the interest for qualified education expenses.
- Purchases are capped at $10,000 per person per calendar year, and the allowance resets on Jan. 1, 2027, which gives household money a hard deadline.
The comparison
Most of the AI Trade Now Produces Less Cash Than the Bond Pays
Put the savings bond next to the cash the AI capital-spending chain actually produces and the comparison stops being theoretical. Over the trailing twelve months Microsoft generated $60.0 billion of free cash flow against a market value near $3.9 trillion, Alphabet produced $19.7 billion, and Amazon lost $46.9 billion. The four largest hyperscalers together converted $615 billion of trailing capex into $61 billion of trailing free cash flow — a cash yield that sits below a savings bond paying 5.51% with no volatility.
Trailing free-cash-flow yield against the 5.51% I-bond composite
Cash-flow yield is cash generated per dollar of market value, not an expected return. CoreWeave, at negative 45%, is left out to keep the scale readable.
Unit: %
Fiscal 2026, ended Sept. 3, 2026
5.9%
Series I composite
New purchases, Nov. 1, 2026 to Apr. 30, 2027
5.5%
Trailing twelve months to July 26, 2026
2.6%
Trailing twelve months to Aug. 2, 2026
2.5%
Trailing twelve months to Sept. 30, 2026
2.1%
Trailing twelve months to Sept. 30, 2026
1.5%
Trailing twelve months to Sept. 30, 2026
0.6%
Trailing twelve months to Sept. 30, 2026
-1.8%
Trailing twelve months to Aug. 31, 2026
-7.3%
| Company | Capex | Free cash flow | Capex ÷ operating cash flow | Trailing earnings yield |
|---|---|---|---|---|
| Microsoft | $135.9B | $60.0B | 69% | 3.67% |
| Alphabet | $159.8B | $19.7B | 89% | 6.91% |
| Meta Platforms | $104.4B | $28.7B | 78% | 4.79% |
| Amazon | $215.2B | −$46.9B | 128% | 5.25% |
| Nvidia | $7.4B | $127.0B | 5% | 3.87% |
| Micron | $30.7B | $59.0B | 34% | 8.50% |
| Broadcom | $1.3B | $39.4B | 3% | 2.46% |
| Oracle | $75.7B | −$28.7B | 161% | 4.88% |
| CoreWeave | $20.6B | −$13.7B | 298% | n.m. |
Cash-flow yield is not an expected return, and the capex is buying assets rather than burning them. It is still the figure a household's alternative now has to beat, and for six of the nine names above the trailing earnings yield also sits below the 5.51% composite. The AI complex must clear a bar set by a savings bond rather than by the 10-year note.
Who pays now
The Buildout Did Not Slow — It Moved Onto the Balance Sheet
None of that stopped the spending; it changed who pays for it. Alphabet, Amazon, Meta and Oracle issued more than $228 billion of bonds through Oct. 13, 2026 — more than double their combined issuance for all of 2025 — while JPMorgan expects hyperscaler outlays of $800 billion in 2026 and more than $1 trillion a year by 2027, most of it financed with debt. Reuters, reporting the same week, put global AI capital spending at $900 billion for 2026 and $5.5 trillion by 2030.
Trailing capex as a share of operating cash flow
Above 100% means the company is spending more cash on property and equipment than it generates from operations.
Unit: %
Trailing twelve months to July 26, 2026
5.5%
Fiscal 2026, ended Sept. 3, 2026
34.2%
Trailing twelve months to Sept. 30, 2026
69.4%
Trailing twelve months to Sept. 30, 2026
78.5%
Trailing twelve months to Sept. 30, 2026
89%
Trailing twelve months to Sept. 30, 2026
127.9%
Trailing twelve months to Aug. 31, 2026
161.2%
Trailing twelve months to June 30, 2026
297.6%
- Oracle funds its AI buildout with $155.9 billion of total debt and $119.6 billion of net debt; interest expense of $1.4 billion in the August quarter was up roughly 50% year on year, and S&P cut the credit to BBB− in July.
- CoreWeave paid $640 million of interest on $2.6 billion of quarterly revenue — about a quarter of sales — against $45.2 billion of net debt, a B rating from S&P and five-year credit default swaps that topped 1,140 basis points.
- Five issuers — Alphabet, Meta Platforms, Amazon, Oracle and CoreWeave — added $326.5 billion of net new debt over the trailing twelve months.
This is the mechanism that ties a savings-bond rate to an equity trade. When the household's guaranteed alternative prints 5.51% while the 10-year Treasury prints 4.98%, the marginal dollar that would have funded AI equity has somewhere better to sit. The buildout did not need retail love; it needed a credit market — and it got one, at a cost that rises with every basis point in the risk-free rate.
Supply chain
The Chain Re-Ranks: Scarcity Owners Collect, Capital Consumers Dig
A higher household hurdle does not kill AI demand, but it re-prices who captures the returns inside the chain. The tier that converts capital spending into cash looks different from the tier that converts cash into capital spending, and the gap between them is now wider than the 5.51% coupon.
- Micron still out-earns the bond with a 5.89% trailing free-cash-flow yield on $59.0 billion of free cash flow, with capex at just 34% of operating cash flow.
- SK hynix holds the scarcest input: UBS expects it to take roughly 70% of HBM4 share on Nvidia's Rubin platform in 2026, with memory demand forecast to grow about 30% and the HBM market to reach $54.6 billion, up 58%.
- Broadcom sells the custom silicon that drags HBM with it — Goldman Sachs expects HBM demand tied to custom-ordered AI chips to rise 82% in 2026, about a third of the market — while spending just 3% of operating cash flow on capex.
- Taiwan Semiconductor Manufacturing turns the chain into wafers, spending about 35% of revenue on capex for a 2.4% trailing free-cash-flow yield: an efficient toll with a small toll.
- Nvidia collects on all of it, with $127.0 billion of trailing free cash flow on $7.4 billion of capex, and reports in mid-November.
The re-ranking has a blunt conclusion for allocators. The names that sell into hyperscaler budgets keep their order books whatever a household earns; the names that must be funded by those households keep discounting the same cash flows against a bond that now pays more than most of them generate. The payoff migrates upstream to the tier that turns capital spending into cash.
Fiscal arithmetic
For a $40.4 Trillion Debt, I-Bonds Set a Price — They Do Not Fund a Deficit
The savings bond is a small instrument next to the federal balance sheet, and pretending otherwise would be the biggest error in this story. Gross federal debt reached $40.4 trillion on Oct. 19, 2026 — $32.5 trillion held by the public and $7.9 trillion intragovernmental — and the FY2026 deficit came in at $1.99 trillion. Savings bonds are 0.5% of debt held by the public, and the annual purchase limit is $10,000 per person, so matching one year of the FY2026 deficit with I-bonds alone would take roughly 200 million households buying their full allowance every year.
The public's balance sheet
Gross federal debt
$40.4T
Oct. 19, 2026
Debt held by the public
$32.5T
Oct. 19, 2026
Intragovernmental holdings
$7.9T
Oct. 19, 2026
FY2026 federal deficit
$1.99T
Final Monthly Treasury Statement, September 2026
Savings bonds
0.5% of public debt
Through September 2026
I-bond purchase cap
$10,000 per person per year
Electronic purchases at TreasuryDirect
So the instrument's function is price discovery, not financing. I-bonds set the price of household patience rather than funding the deficit — and that price is now the reference point against which every AI-linked capital plan is judged. The competition for the same savings is explicit: $228 billion of AI-related corporate bonds through Oct. 13 plus $326.5 billion of net new debt in twelve months from five issuers, all competing with the Treasury for a pool of money that has just found a government guarantee paying 5.51% with no mark-to-market.
Horizons
Two Quarters of Catalysts, Three Years of Consequences
| Horizon | Catalyst | Why it matters | What to watch |
|---|---|---|---|
| Days to quarters | Series I window opens Nov. 1, 2026 | 5.51% applies to purchases through Apr. 30, 2027 | Pacing of household purchases at TreasuryDirect |
| Days to quarters | Nvidia reports mid-November | First live read on whether hyperscaler capex converts into orders | Nvidia data-center revenue and forward guidance |
| Quarters | 2027 capex guides, late January to February | Sets the order book for memory, foundry and power | Alphabet against $195–205 billion and Microsoft against $170 billion |
| One to three years | Credit-funded buildout above $1 trillion a year | If equity stops funding capex, the bond market must | Interest coverage and capex as a share of operating cash flow |
| One to three years | May 1, 2027 rate reset | A softer composite cuts the household's bar toward 3.40% | The semiannual inflation rate announced each May and November |
The near-term path is mechanical. The 5.51% window opens Nov. 1, 2026 and closes Apr. 30, 2027, and the $10,000 per-person allowance resets on Jan. 1, 2027, which pulls household money forward into 2026 purchases. Nvidia's mid-November report is the first test of whether hyperscaler capital spending still converts into orders, and the 2027 guides from Alphabet and Microsoft in late January and February are the number that decides whether the memory and foundry chain gets another year of demand.
- Inflation re-acceleration lifts the composite again and tightens the household's bar further, widening the gap with AI cash yields.
- A Fed easing cycle pulls the 10-year below 4.98% and hands the household back the choice of a liquid, marked-to-market Treasury.
- Faster AI monetization flips the argument: positive free cash flow at Amazon or Alphabet dissolves the cash-yield case altogether.
- Memory digestion is the first link to break if 2027 hyperscaler guides fall — Micron and SK hynix sell into capital plans, not into household portfolios.
Where the 5.51% bar lands
- trades on a 3.87% trailing earnings yield, below the 5.51% I-bond composite, so it now needs growth rather than yield to clear the household's bar.
- A 2.56% trailing free-cash-flow yield on $127.0 billion of free cash flow funds the chain without capex of its own: capex is 5% of operating cash flow.
- Mid-November results are the binary catalyst — they decide whether hyperscaler capital spending survives the October drawdown.
- If orders hold, the toll booth keeps collecting even while household money earns 5.51% risk-free.
- cut 2026 capital spending guidance to $170 billion from $175 billion while trailing free cash flow of $60.0 billion leaves a 1.54% cash yield.
- Trailing capex of $135.9 billion consumes 69% of operating cash flow, so the buildout is funded from cash flow rather than from the equity market.
- Over the next two quarters, a $170 billion plan against Alphabet's $195–205 billion decides who orders the hardware.
- Mixed because a lower plan protects cash conversion while cutting the orders that Micron and the foundry chain sell into.
- posted negative $9.07 billion of free cash flow in the September quarter while holding full-year capex guidance at $195–205 billion.
- Trailing free cash flow of $19.7 billion on $159.8 billion of capex equals a 0.58% cash yield, the weakest of the four largest hyperscalers.
- Shares fell about 13% in one session on Oct. 29, erasing roughly $500 billion of value; the early-2027 guide decides whether the burn continues.
- Over one to three years, a 6.91% trailing earnings yield clears the bond, but it rests on search monetization rather than AI revenue.
- burned $46.9 billion of trailing free cash flow against $215.2 billion of capex, spending 128% of operating cash flow.
- Net new debt of $124.6 billion over the trailing twelve months makes it the largest single corporate borrower in the chain.
- A 5.25% trailing earnings yield sits below the 5.51% composite, so the equity needs cloud cash conversion to justify the buildout.
- Bearish over the next two quarters unless free cash flow turns positive as the pace of capital spending slows.
- carries $155.9 billion of total debt and $119.6 billion of net debt while trailing free cash flow is negative $28.7 billion.
- Interest expense rose about 50% year on year to $1.4 billion in the August quarter, and S&P cut the credit to BBB− in July.
- Capex consumes 161% of operating cash flow, so the equity case now depends on credit markets staying willing at a 4.98% risk-free rate.
- Bearish over one to three years unless cash conversion improves, because the funding model is debt rather than equity.
- pays about a quarter of its revenue in interest: $640 million against $2.6 billion of quarterly revenue, up from $267 million a year earlier.
- Net debt of $45.2 billion and trailing free cash flow of negative $13.7 billion leave capex at 298% of operating cash flow.
- S&P rates it B and five-year credit default swaps topped 1,140 basis points; a 4.98% risk-free rate raises the cost of every dollar it adds.
- Bearish over the next two quarters, because refinancings at wider spreads are how an AI capital cycle becomes an equity problem.
- still out-earns the bond with a 5.89% trailing free-cash-flow yield on $59.0 billion of free cash flow.
- Capex of $30.7 billion consumes just 34% of operating cash flow, so the memory tier self-funds the buildout the hyperscalers cannot.
- Bullish over one to three years while memory demand grows about 30% in 2026 and HBM supply stays allocated to sold platforms.
- The first break is order digestion if 2027 hyperscaler guides fall, not household demand.
- holds the scarcest input in the chain: UBS expects roughly 70% of HBM4 share on Nvidia's Rubin platform in 2026.
- Memory demand is forecast to grow about 30% in 2026 and the HBM market to reach $54.6 billion, up 58%, so pricing power sits upstream of the equity drawdown.
- Bullish over one to three years: it sells into hyperscaler capital plans rather than household savings, so the 5.51% rate does not touch its order book.
- The risk is order digestion, not household demand, if 2027 hyperscaler guides are cut.