
S&P 500 (Oct 16, 2026)
-1.09%
Closed 7,659.44, down 84.62 pts
Nasdaq Composite
-2.14%
Closed 26,140.03, weekly loss ~4%
VIX
19.99
Up 21.45% from 16.46 prior session
10-Year Treasury
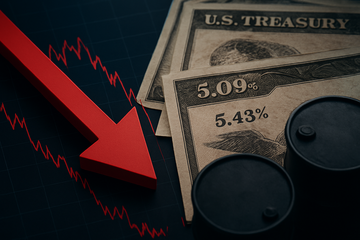
5.09%
30Y at 5.43%; 2Y at 4.72%
Brent crude
+3.7%
Settled $109.86/bbl, first triple-digit close since July
Dec Fed hike odds
74.3%
Up from 50.2% one month earlier, per CME FedWatch
Three Wedges, One Session — The Anatomy of Friday's Triple Hit
Three forces converged on Friday Oct 16, 2026, and each pushed the same lever — long-duration cash flows, including stocks priced on cash flows that arrive far in the future. The Iran–Hormuz escalation pushed Brent crude up 3.7% to $109.86 a barrel, the first triple-digit close since July, after Iran attacked nine commercial vessels since Sunday and sank the GFS Pride on Wednesday; shipments through the Strait had fallen to about 9.4 million barrels a day, roughly 70% of pre-war flows. Sticky U.S. inflation made the oil shock worse: Thursday's September PPI landed at +6.3% year-on-year — the biggest wholesale-price gain since 2022 — one day after the September CPI printed +3.7% year-on-year. And the Treasury market repriced as a result: the 10-year yield held at 5.09% after touching 5.10% the prior session, the 30-year climbed to 5.434%, and CME FedWatch priced the December FOMC hike at 74.3% — up from 50.2% a month earlier.
Read together, those three wedges pushed the VIX from 16.46 to 19.99 — a 21.45% one-day spike — and dragged the Nasdaq Composite down 2.14%, the S&P 500 1.09%, and the Dow 0.3%. The index-closing data above tells the daily surface. The sector-closing data below tells the real story: a clean separation between AI enablers and AI infrastructure debt that the bond market executed in real time.
The Bond Market's Pain List: Who Actually Got Hit, and Why
The cleanest read on Friday is not the index moves — it is the spread between Nvidia and CoreWeave. Nvidia closed at $214.13, down 1.43% on the day, a roughly $5.16 trillion company with 12% debt-to-assets and 0.6% debt-to-market-cap. CoreWeave closed at $61.39, down 11.9%, with 67% debt-to-assets and 91% debt-to-capital — a balance sheet built around AI compute that has to be rolled at whatever yields the bond market offers. Broadcom closed at $328.75, down 4.52%, after spending weeks absorbing the message that $70 billion-plus in AI-related capex needs bond-market financing. Oracle closed at $128.22, down 4.65% — and is now roughly 58% below its 52-week high of $304.28, with about $130 billion of debt and FY2026 capex of $55.7 billion, up 162% year-on-year.
- CoreWeave: -12% on Oct 16; bond yields above 15%; 91% debt-to-capital; capex was 271% of trailing revenue.
- Oracle: -4.65% on Oct 16; ~58% off the 52-week high of $304.28; ~$130B debt; FY26 capex $55.7B (+162% YoY).
- Broadcom: -4.52% on Oct 16; trailing P/E 43.3x, EV/EBITDA 30.7x — the multiple the bond market is now re-pricing.
- Nvidia: -1.43% on Oct 16; debt-to-market-cap 0.6%; the AI cash-flow owner, not the AI debt-payer.
Small-Caps Joined the Pain List — REITs and Banks Are the Latent Names
Small-caps took the day's most predictable hit. The iShares Russell 2000 ETF closed at $270.44, down 1.66% on Oct 16, slightly worse than the S&P 500 in percentage terms and worse on the week. Small-caps carry floating-rate debt, fund themselves in the same5%+ world, and have the thinnest free cash flow cushion against a December rate hike. The IWM NAV is also about 9% off its mid-August record high, with roughly $3.3 billion of ETF outflows in recent weeks per industry coverage — a setup that turns the next CPI print into a margin-of-safety question for the cohort.
Realty Income and Welltower did not move much on Friday — XLRE closed flat at $42.14, and Realty Income actually ticked up 0.95% — but they are the latent names on this list. Realty Income carries a 5.8% trailing dividend yield and a 40.6x trailing P/E with a 1.32x price-to-book; Welltower runs at 105x trailing earnings with 5.9x net debt to EBITDA. Their economics are duration in disguise: long-dated leases, refinance-heavy balance sheets, and asset values discounted back at the 10-year. The 10Y at 5.09% does not yet break them; a 5.30% retest would. The 30Y at 5.43% is already closer to that break point than the10Y.
| Ticker | Name | Day move | Closing detail |
|---|---|---|---|
| CRWV | CoreWeave | -11.9% | Bond yields >15%; 91% debt-to-capital |
| ORCL | Oracle | -4.65% | ~$130B debt; FY26 capex +162% YoY |
| AVGO | Broadcom | -4.52% | Trailing P/E 43x; EV/EBITDA 31x |
| IWM | Russell 2000 ETF | -1.66% | Small-cap beta to Fed-hike odds |
| NVDA | Nvidia | -1.43% | Debt-to-market-cap 0.6%; AI enabler |
| XLRE | Real Estate ETF | -0.05% | Latent; 10Y at 5.09% still tolerable |
The Beneficiaries: Energy and the Curve Steepener
The same Friday that punished AI-debt names handed real cash flow to integrated oil. Exxon Mobil guided to roughly $4.5 billion in incremental refining earnings for Q3 on the back of the oil move, even as it warned of a $1.3 billion upstream hit from lower volumes. Brent at $109.86 — versus about $72 in late February before the Iran war — is a cost-push shock for almost every other sector and a tailwind for the integrateds, refiners, and U.S. shale producers. This is the second-order point the bond market is also pricing: the same5%+ yield curve that breaks leveraged AI debt also pulls forward cash flow for anyone with a barrel.
Regional banks held up on Friday — the KBW Regional Banking Index (KRX) closed at 135.39, up 0.16% — because the 2Y/30Y curve steepened slightly (2Y at 4.715%, 30Y at 5.434%, a 72 basis-point spread). Curve steepening is the textbook setup for regional-bank net interest margin expansion. The risk is the other side: if the bond market starts pricing credit risk on commercial real estate loans into regional-bank balance sheets, the steepener thesis fails. That makes small-cap REITs and regional banks a paired position risk for the next two prints.
The Calendar: Nov 10 CPI, Dec 9 FOMC, and What the Bond Market Will Read Between Them
Two data points dominate the next six weeks. Nov 10: the October CPI release. Dec 9: the FOMC meeting, where the 74.3% December hike probability gets confirmed, walked back, or repriced higher. The bond market's pain list above is the implied equity response to either outcome: hot CPI + a hike deepens the AI-debt and small-cap drawdown; cool CPI + a hold opens the door for a year-end relief rally in the same names that got hit first. Q3 earnings season is also in progress — FactSet's Oct 16 update points to 28.6% Q4 2026 earnings growth and 32.8% full-year 2026 earnings growth — which means the AI infrastructure names have to defend their capex math in real earnings calls between now and mid-November.
Short-term (days–quarters), the order of operations is: bond yields and oil set the ceiling, AI-infrastructure bond spreads and small-cap relative strength set the canary, and the VIX re-rate from 16 to 20 in a single session is the volatility budget every long-only fund is now spending. Long-term (1–3 years), the structural call is whether 5% yields become the floor or the average — and that question will be settled more by the trajectory of capex-to-revenue at AI infrastructure names than by any single Fed decision. Nvidia's capex-to-revenue is 2.4%; CoreWeave's is 271%; Oracle's is 105%. The bond market is not guessing which side survives the 5% world. It already priced it on Friday.
Stocks this event actually moves
- Bond yields above 15% on Friday turn the AI-infrastructure capex math against the equity until either rates fall or backlog revenue accelerates.
- Trailing capex-to-revenue of 271% and 91% debt-to-capital make refinancing the binding constraint, not earnings.
- Short-term: the Nov 10 CPI and Dec 9 FOMC set the ceiling on bond-yield relief that this name needs.
- Long-term (1–3 years): equity survival depends on the companyconverting debt into revenue at a multiple the bond market accepts.
- Stock is down ~58% from its $30452-week high with FY26 capex up 162%, and the 5% yield world is the cause.
- Net debt to EBITDA of 3.2x and debt-to-assets of 51% cap how much new AI capex the bond market will underwrite at current valuations.
- Short-term: Q2 FY26 earnings (reported late September) set the credibility test for the $70B capex plan.
- Long-term: a 5% sustained 10Y compresses the AI-services multiple the stock needs to refinance the AI infrastructure.
- Trailing P/E of 43.3x and EV/EBITDA of 30.7x is the multiple the bond market is repricing; -4.52% on Friday is the opening bid.
- AI capex exposure puts Broadcom in the same debt-financed cohort as Oracle and CoreWeave, with a higher P/E and less margin of safety.
- Short-term: AI revenue growth in upcoming earnings has to outrun rate-driven multiple compression.
- Long-term: Broadcom is the most index-weighted AI-debt proxy in the S&P 500 and the cleanest single-name pain-list expression.
- -1.66% on Oct 16 with about $3.3B of recent outflows confirms small-caps are first on the bond-market pain list.
- Floating-rate debt exposuremakes the cohort a direct expression of December Fed-hike odds at 74.3%.
- Short-term: the Nov 10 CPI is the binary catalyst for whether small-caps hold support.
- Long-term: a sustained 5%+ 10Y keeps the Russell 2000 multiple-compressed relative to the S&P 500, which is the trade that has actually been working.
- Flat on Friday but a 5.8% yield and 1.32x P/B make this the latent REIT pain-list name if the 10Y retests 5.30%.
- Trailing P/E of 40.6x leaves no room for a re-rate without falling bond yields.
- Short-term: the Nov 10 CPI determines whether the 10Y rolls over or through 5.10% — that is the entire REIT trade.
- Long-term: 5% as a floor permanently caps the dividend-growth multiple the S&P 500 REIT cohort has historically commanded.
- Trailing P/E of 105x and net debt to EBITDA of 5.9x is the most stretched REIT balance sheet on the list.
- Healthcare-REIT cash flows are long-dated and discount back hardest at a 5%+ 10Y.
- Short-term: 30Y at 5.43% is closer to breaking Welltower's economics than the 10Y — watch the 30Y, not just the 10Y.
- Long-term: senior-housing demographic tailwinds can only offset rate compression if the discount rate stabilizes.
- Debt-to-market-cap of 0.6% and trailing P/E of 27x leave Nvidia structurally insulated from the AI-debt compression; -1.43% on Friday vs CoreWeave -12% proves it.
- Beta of 2.2 means Nvidia still trades the volatility budget — it is not immune, just better positioned.
- Short-term: customer-credit quality (CoreWeave, neoclouds, hyperscalers) is the second-order risk that could drag even Nvidia into the same drawdown.
- Long-term: Nvidia owns the AI cash flow, not the AI debt, so a 5% world widens the moat relative to leveraged customers.
- $4.5B incremental Q3 refining earnings guidance on the Iran-driven oil move turns the 5%+ yield environment into a cash-flow tailwind for the integrateds.
- Brent at $109.86 vs $72 in late February pulls forward two to three quarters of free cash flow for U.S. shale.
- Short-term: any de-escalation in Hormuz is the only catalyst that breaks this trade.
- Long-term: cost-push inflation from oil keeps the Fed hawkish, which is bad for bonds but good for the integrated balance sheet.