
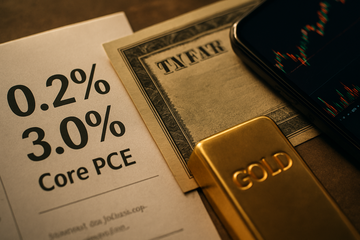
Core PCE, m/m
+0.2%
August 2026; consensus +0.3%, July +0.2% (revised)
Core PCE, y/y
+3.0%
August 2026; consensus +3.3%, July +3.0% (revised)
Headline PCE, m/m
+0.3%
August 2026; consensus +0.3%
Headline PCE, y/y
+3.4%
August 2026; consensus +3.7%, July +3.4%
Personal income, m/m
+0.2%
August 2026; consensus +0.4%
Personal spending, m/m
+0.9%
August 2026; consensus +0.8%
0.2% Core PCE Is the Cleanest Disinflation Print in Three Months
The August core PCE print, released September 30 by the Bureau of Economic Analysis, was the softest underlying-inflation read in three months and undershot consensus on both the monthly and annual gauges. Core PCE rose 0.2% m/m against a 0.3% Dow Jones estimate and matched July's downward-revised pace; the y/y rate held at 3.0%, three-tenths below the 3.3% the Street had penciled in. Headline PCE at 0.3% m/m and 3.4% y/y beat a 3.7% consensus on the annual line, but the energy-driven beat was offset by a soft services line. Shifts the burden of proof back to the hawks — at 3.0%, core is still a full percentage point above the Fed's 2% target.
Warsh Has the Cover to Skip a Hike — but the Dot Plot Keeps December Live
Two weeks before the soft August print, Chair Kevin Warsh led a unanimous 12-0 FOMC vote to lift the federal funds rate 25 basis points to 3.75-4.00% — the Fed's first hike since 2023. The accompanying Summary of Economic Projections pushed the year-end 2026 funds rate to a 4.00-4.25% range, raised the Fed's own PCE estimate to 3.7% from 3.6%, and pushed the projected return to 2% out to 2029. Sixteen of 18 policymakers expect at least one more quarter-point of tightening this year; four want a full second 25 bps hike.
The Bond Market Isn't Waiting for the Fed: The 10-Year at 5.34% Is the Real Vote
10-Year Treasury Yield Hits Levels Last Seen in 2002
Soft core PCE did not break the trend — the 10Y held above 5.2% on Oct 1, with an intraday high of 5.344%, and the 30Y reached a 24-year peak at 5.613%.
Unit: %
Jul 21, 2026
4.6
Sep 14, 2026
5
Sep 30, 2026
5.3
Oct 1, 2026 (intraday high)
5.3
The bond market priced the August print as more hawkish than the Fed, not less. The 10-year Treasury hit 5.344% intraday on October 1 before pulling back just 5 basis points to 5.243% by the close; the 30-year touched a 24-year high at 5.613%. That pullback is a rounding error against the year's100 bps move higher in long-duration yields — a move that began in mid-September after Warsh telegraphed a hike at Jackson Hole. The October 1 reaction was the bond market telling the Fed the September dot plot was the floor, not the ceiling.
Gold's Push Past $4,200 and the S&P 500's 7,666 Tell the Same Story
Gold pushed through $4,200 for the first time the same week, with spot hitting an intraday high of $4,220.15 before settling near $4,177-$4,204. The move is not a liquidity story: real rates have risen alongside nominal yields and the dollar is firm. The trade is a debasement hedge — gold as the alternative to a fiscal trajectory the bond market is actively pricing at multi-decade yield highs —and the breakout suggests institutions are repositioning, not just retail.
The S&P 500 closed at 7,666.45 on October 1, up 0.19% and off a two-week low, after clawing back early losses as Treasury yields pulled back from their intraday highs. The Nasdaq eked out a 0.04% gain to 26,871.60; the Dow added 20.51 to 50,926.56. Soft core PCE cut October's hike-implied odds, and the equity marketcleared the soft print without a single rate-sensitive sector breaking.
Three Catalysts That Move the Floor Before the December Decision
- September CPI on Oct 14, 2026 — consensus expects a 0.3% m/m read; a hot print would re-anchor December hike expectations, while a soft print locks in the disinflation trend
- October FOMC on Oct 28-29 — markets price the meeting as a hold after soft PCE, but the dot plot still signals a year-end move and four dissenters want another hike
- December FOMC on Dec 16-17 — the4.1% median funds rate and four-of-18 hawks put December squarely in play; the question is the data between now and then
How to Position for the Print That Cooled and the Bond Market That Didn't
- Captured the $4,200 breakout on softer core PCE as October hike odds fell and institutions repositioned
- Tracks spot gold at $4,177-$4,220 (Oct 1, 2026), giving equity holders direct exposure without miner leverage or operating risk
- Anchors a new inflation hedge floor near the 95.6% YoY gain set since the Jan 29, 2026 low
- 10-year at 5.344% and 30-year at 24-year highs locked in duration losses, the worst-positioned trade in the new rate regime
- Yield to maturity at 5.29% versus 4.93% prior leaves TLT exposed to further price compression if Warsh's 4.1% dot plot holds
- Fiscal term premium and the Fed's hawkish hold thesis keep long-duration Treasuries out of favor even after soft PCE
- Cleared the soft print to close at 7,666.45 (+0.19%) on Oct 1, capping a recovery from a two-week low
- Soft PCE keeps October hike off the table, supporting the equity leg of the cross-asset divergence into year-end
- Forward earnings multiple has expanded alongside rate normalization, with the Dow at 50,926.56 and the Nasdaq at 26,871.60
- Funds rate at 3.75-4.00% with a 4.1% dot plot median widens the NIM into 2027
- Bond portfolio losses from the 10-year at 5.34% are offset by deposit cost relief as front-end rates lag
- Cleanest expression of the Warsh hawkish hold trade among money-center banks heading into the December decision
- Amplifies the $4,200 gold breakout with senior-miner operating leverage to higher spot
- Q3 earnings benefit from spot above $4,200 against full-year production guidance of 2.9-3.25 million ounces
- Industry-leading AISC in the $1,760-$1,950/oz range leaves a $2,400+ margin at current spot