
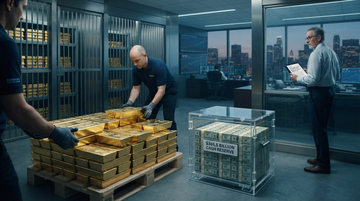
A September 6, 2026 Yahoo Finance / AOL piece (citing Goldman's October 2025 HNW survey and UBS's 2026 Global Family Office Report) crystallized a signal the market had been parsing in pieces: the cohort most likely to call the top is no longer buying stocks with its marginal dollar. The Goldman survey of 1,000 US HNW investors—fielded July 18 to August 8, 2025—found cash and cash equivalents still sit at roughly 20% of net worth across every wealth tier ($1–5M, $5–10M, $10M+), with 48% citing wealth preservation and 46% flexibility. UBS's May 2026 report, covering 307 family offices averaging $2.7B in net worth, shows 60% plan to shift strategic asset allocation in the next 12 months and gold's target weight rises from 2% in 2025 to 3% in 2026. The two readings, taken together, are the cleanest 2026 version of an old tell: sticky money is hedging before the crowd.
The Cash Stack: 20% in Cash, $365.5B at Berkshire, and a Goldman Survey That Refuses to Move
- $1–5M tier: 16% in cash · $5–10M tier: 21% · $10M+ tier: 20% · survey-wide average: 18%
- Berkshire Hathaway reported $35.1B in cash and cash equivalents plus $324.9B in short-term US Treasury bills at June 30, 2026, down $31.9B from the $397.4B record set March 31, 2026 as Greg Abel deploys cash into buybacks and select equity purchases
- Across H1 2026, Berkshire Hathaway bought $39.4B of equities and sold $27.8B; first-half Treasury acquisitions totaled $4.4B, with 60% of family offices in the UBS survey now planning strategic allocation changes in the next 12 months
Why the cash number matters: in a year the S&P 500 is up roughly 13% YTD and on track for 27 record closes, the cohort with the longest time horizon and lowest income-replacement risk is still sitting on an 18–20% cash buffer. The Goldman survey's data is more than a year old at this point, but the persistence is what makes it informative—the very same investors who refused to chase the 2024–2025 AI rally are now facing a market up another ~13% and still adding to the buffer. The Berkshire filing is the corroborating institutional print.
The Gold Tilt: UBS Family Offices Go From 2% to 3%—And ETF Money Starts to Confirm It
- Real estate drops from 11% to 8% in the same allocation shift, with gold and emerging-market equities the named beneficiaries
- Global gold-backed ETFs attracted $3B in net inflows in July 2026 (rebounding from two months of outflows); year-to-date inflows $11B, lifting collective holdings to 4,068t—still below the 4,176t record set February 27, 2026
- European-listed funds led July with $2B in inflows; the SPDR Gold Shares trust alone manages $149.3B in assets as of September 4, 2026
The 2%→3% number looks small until you multiply it: UBS's respondent cohort averages $2.7B in net worth across 307 offices, implying $828M of fresh gold demand per office per percentage point of allocation. The rotation away from real estate (–3pp) into gold (+1pp) and other listed alternatives is exactly the textbook late-cycle pattern—holdings go from illiquid to liquid, from yield to optionality. ETF flows are confirming it, but the demand isn't speculative retail: World Gold Council data shows central banks bought 289t in Q2 2026 alone.
The Math: How Big Is the Disconnect Between Indexing and the Smartest Money?
S&P 500 YTD return (2026, through Sep 7)
≈13%
with 27 record closes and 18% forecast year-end return per Goldman Sachs Research (May 28, 2026 update to 8,000 target)
FINRA investor margin debt (July 2026)
$1.42T
down 5.7% from June 2026 but up 39% year-on-year; growth this fast has appeared in only 34 of 343 months on record
Equity funds outflow (July 2026, ICI)
−$102.8B
long-term equity mutual funds saw $102.8B in outflows in July, while ETFs added $32.0B in net issuance
Hyperscaler AI capex (Goldman forecast)
$770B
consensus for 2026 capex spend across the five largest hyperscalers, equivalent to 100% of cash flows from operations
The index-level rally is being held up by two very different flows. Retail and ETF channel buyers are leaning in—margin debt is up 39% YoY and the ICI's July data show continued migration from mutual funds into ETFs, the structural pattern of the last decade. But the smartest, slowest, longest-duration money is doing the opposite: 20% cash and 3% gold. The AI capex number is the bridge. With hyperscalers slated to spend $770B in 2026—100% of operating cash flow—Goldman Sachs Research's own data shows the S&P 500 ROE reached a record 22% in Q1 2026 precisely because capex is being written off fast. That's the bull case. The bear case is the one Buffett and the family offices are quietly positioning for: a market where the marginal bid comes from corporate cash flows, not new savers.
Where the Money Lands: The Gold Miners Are Already Pricing the Bid
| Company | Q2 2026 production | Q2 2026 revenue | Q2 2026 free cash flow | Realized gold price |
|---|---|---|---|---|
| Newmont | 1.29M attributable oz | $7.31B | $2.20B | $4,414/oz |
| Barrick Mining | 796K oz (exceeded 730–770K guidance) | $5.29B | $141M (attributable) | $4,417/oz |
| Agnico Eagle | 856K oz (above budget) | n/d (FY total cash costs $1,054/oz) | record quarterly FCF (per release) | n/d (release: $4,385/oz on Jul 30) |
The producers are seeing it. Newmont's Q2 2026 earnings grew 47% year-over-year even with a 13% sequential gold price correction—the company called out operating leverage as the mechanism. Barrick Mining beat the high end of its own gold production guidance and is generating $1.7B in operating cash flow. Agnico Eagle booked a record quarterly free cash flow. The message in the prints is consistent: even at gold prices down meaningfully from the February peak, the cost base is low enough that every $100/oz on the price reads almost dollar-for-dollar to free cash flow. The mining side is the most direct way to play the family-office gold tilt without paying ETF storage costs.
The Wealth-Manager Catch: Goldman and UBS Both Win, But in Different Ways
- Goldman Sachs Q2 2026: Asset & Wealth Management revenue $4.60B (+20% YoY); assets under supervision hit a record $4.04T, up from $3.65T in Q1 2026; quarterly EPS $20.98, ROE 23.5%
- UBS Q2 2026: Group net profit $2.8B, H1 net new assets in Global Wealth Management $73B, group invested assets $7.3T (record); GWM revenue $7.11B (+13% YoY)
- Both firms sit in the sweet spot: more assets under supervision (cash plus gold) earns fees on the way in, then earns trading and lending revenue when the cash eventually deploys
The wealth managers aren't victims of the cash-and-gold rotation—they're beneficiaries. Goldman Sachs added $390B of AUS in a single quarter, and UBS booked $36B of net new assets in Q2 alone. Every dollar of family-office cash that flows into a separately managed account pays an advisory fee; every dollar of new gold ETF allocation pays a custody fee. The reason the wealth managers have a 17% higher trailing multiple than pure-play asset managers is exactly this—their revenue base is a function of de-risking, not just of equity beta. Watch AUS growth as a real-time tell of how much of the 20% cash buffer is coming off the sidelines.
Short-Term vs. Long-Term: The Two-Horizon Read
The horizons tell opposite stories for different stocks. Miners benefit near-term but face the same risk as gold itself if real yields rise on a Fed pause—watch the November 2026 FOMC meeting as the first major catalyst. The wealth managers are the highest-quality compounders in the rotation: their AUS growth compounds through any market regime, and the higher the cash buffer, the higher the fee base. BlackRock sits in between—record AUM in iShares Gold Trust (~$65B in trust assets) and SPDR Gold Shares ($149B) means ETF flows are a meaningful earnings line, but BlackRock is also the index beneficiary if the AI rally continues. The most asymmetric setup belongs to the CME Group—gold futures and options set a new daily record of 4.2M contracts on January 30, 2026, and Q2 2026 metals volume is up sharply; whichever direction the HNW money moves, the venue prints.
Synthesis: A Topping Process, Not a Crash Signal
Cash+gold rotation is the slowest, smartest money telling you it doesn't trust the next 6–12 months of equity returns. It is not a panic signal—there are no blow-up indicators in the data: margin debt ticked down in July, ETF inflows recovered, central banks are still buying. What it is, is a positioning tell. When 60% of family offices plan allocation changes in a year and the Goldman cohort still holds 20% cash, the S&P 500 rally is being held up by flows (retail, AI capex, ETF migration) that have nothing to do with the marginal high-net-worth saver. The topping process is the divergence: index records on one side, ~$365B in cash plus a +50% planned gold tilt on the other. The investors to own through that divergence are the ones monetizing the rotation itself—Newmont, Barrick, Agnico Eagle on the gold side, Goldman Sachs and UBS on the wealth-management side, BlackRock and State Street on the ETF plumbing, and CME Group on the volume.
Investable names with established linkages to the cash-and-gold rotation
- Q2 2026 cash + Treasury bills at $360B ($35.1B cash + $324.9B T-bills) anchors the 'ultra-rich cash' datapoint; $397.4B March 2026 record is the 'sticky money' ceiling
- $4.4B of H1 2026 buybacks plus $39.4B of equity purchases vs. $27.8B of sales show cash already being deployed at the margin; 23% Berkshire Q2 net income surge suggests the cash buffer is being put to work, not waiting
- Low beta (0.61) and 12.7x trailing P/E make Berkshire Hathaway the cleanest 'hold the cash with you' trade if the rotation extends; a 1–3 year structural underweight in equities by UHNW flows directly benefits Berkshire's float-heavy insurance model
- Asset & Wealth Management Q2 2026 revenue +20% YoY to $4.60B and AUS up to record $4.04T (from $3.65T in Q1 2026) is the cleanest earnings print of the HNW rotation thesis
- Goldman Sachs Asset Management is the issuer and beneficiary of the same HNW allocation survey that drives the 20% cash narrative; its October 2025 report on alternatives is the dataset being cited in September 2026
- Short-term: Q2 EPS of $20.98 and 23.5% ROE price in the AUS growth; long-term: every percentage point of $7.5T+ HNW cash that comes off the sidelines over 1–3 years is incremental fee revenue at Goldman Sachs
- Q2 2026 group net profit $2.8B and Global Wealth Management H1 net new assets of $73B confirm UBS is harvesting the 3% gold + 20% cash rotation in real time
- $7.3T in group invested assets is the largest direct captive pool of the HNW cohort surveyed; the May 2026 UBS Family Office Report is the source document for the 2%→3% gold allocation shift
- Days–quarters: GWM revenue +13% YoY to $7.11B reads directly in Q2; 1–3 years: the $73B H1 NNA compounds at UBS's fee schedule regardless of market direction
- Q2 2026 attributable gold production of 1.29M oz and record $2.2B free cash flow with $4,414/oz realized price are the most leveraged earnings prints to the family-office gold tilt
- Newmont's 47% YoY earnings growth despite a 13% sequential gold price correction shows operating leverage defends earnings even on a flat gold tape; 2026 production guidance 5.3M oz is back-end loaded (52% H2)
- Short-term: $1,621/oz AISC and $2.2B quarterly FCF give the dividend and buyback room to absorb any gold price wobble; long-term: a 50% family-office gold allocation lift across 1–3 years is direct demand for the primary supply
- Q2 2026 gold production of 796K oz beat the high end of 730–770K guidance; $5.29B revenue and $1.70B operating cash flow prove the cost base converts to cash at the current price
- Barrick Mining 2026 guidance: 2.90–3.25M oz gold with AISC of $1,760–$1,950/oz at $4,500 gold; Q2 realized price of $4,417/oz sits right inside the guidance cost envelope
- Days–quarters: $141M attributable free cash flow and the company has been named in the family-office gold survey as a primary listed-alternative beneficiary; 1–3 years: copper co-product at 190–220kt guidance gives a second leg if AI-driven copper demand materializes
- Q2 2026 gold production of 856K oz above budget for the second consecutive quarter, with total cash costs $1,054/oz, generates the record quarterly free cash flow called out in the release
- Agnico Eagle 2026 production guidance is 340K oz per quarter at the midpoint—a steady-state production profile that the HNW gold rotation reads against as a low-cost producer
- Short-term: low $1,054/oz cash cost gives 75%+ of spot price as operating margin; 1–3 years: dividend and buyback yield is the cleanest 'hold the gold miner' payout among the top three
- iShares Gold Trust AUM of ~$65B (939.95t in trust, Sep 4, 2026) plus BlackRock's share of the SPDR Gold ecosystem means ETF gold flows are a direct BlackRock revenue line
- Q2 2026 revenue $27.3B and 26.9x trailing P/E price in the index flows; record asset management fees include the gold ETF AUM growth
- Days–quarters: each $1B of ETF gold inflows is ~$2.5M of annual fee revenue at BlackRock; 1–3 years: as family offices formally lift gold from 2% to 3%, the institutional ETF complex captures the largest share of new flows
- Gold futures and options set a single-day record of 4.2M contracts on January 30, 2026; Q2 2026 metals volume is up sharply with Micro Gold (MGC) +270% YTD
- CME Group is the venue of record for the gold futures leg of the rotation; every ounce that clears through CME earns clearing fees regardless of direction
- Q2 2026 revenue $1.71B and net income $1.04B show the leverage; long-term: any structural shift toward gold as a portfolio allocation—via family offices, ETFs, or central banks—will pass through CME Group's matching engine