%22%2F%3E%0A%20%20%3Ccircle%20cx%3D%22220%22%20cy%3D%22150%22%20r%3D%22180%22%20fill%3D%22%2322d3ee%22%20fill-opacity%3D%220.12%22%2F%3E%0A%20%20%3Ccircle%20cx%3D%221010%22%20cy%3D%22130%22%20r%3D%22220%22%20fill%3D%22%2338bdf8%22%20fill-opacity%3D%220.08%22%2F%3E%0A%20%20%3Ccircle%20cx%3D%22920%22%20cy%3D%22520%22%20r%3D%22170%22%20fill%3D%22%2322d3ee%22%20fill-opacity%3D%220.06%22%2F%3E%0A%20%20%3Cpath%20d%3D%22M140%20430h920%22%20stroke%3D%22url(%23line)%22%20stroke-width%3D%2212%22%20stroke-linecap%3D%22round%22%2F%3E%0A%20%20%3Cpath%20d%3D%22M220%20360c120-150%20260-220%20380-220s260%2070%20380%20220%22%20fill%3D%22none%22%20stroke%3D%22%2367e8f9%22%20stroke-opacity%3D%220.5%22%20stroke-width%3D%2216%22%20stroke-linecap%3D%22round%22%20stroke-linejoin%3D%22round%22%2F%3E%0A%20%20%3Cpath%20d%3D%22M300%20398h600%22%20stroke%3D%22%2394a3b8%22%20stroke-opacity%3D%220.24%22%20stroke-width%3D%228%22%20stroke-linecap%3D%22round%22%2F%3E%0A%20%20%3Ctext%20x%3D%22220%22%20y%3D%22510%22%20fill%3D%22%23e2e8f0%22%20fill-opacity%3D%220.7%22%20font-family%3D%22Arial%2C%20Helvetica%2C%20sans-serif%22%20font-size%3D%2238%22%20letter-spacing%3D%228%22%3EINSIGHTS%3C%2Ftext%3E%0A%3C%2Fsvg%3E)
Semiconductors / Capital allocation
Samsung paid out more—yet the market wanted proof of the next cash cycle
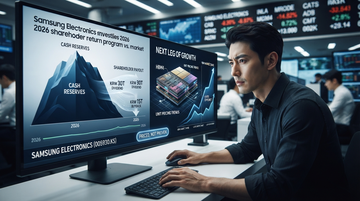
Samsung’s board approved a 2026 shareholder-return plan estimated at KRW 90 trillion–110 trillion (about $65 billion–$80 billion)—a record by Korean-company standards. But the shares skidded anyway, signaling that “cash-return size” is no longer the only variable investors trade in memory.
The key shift for investors: Samsung’s payout policy is now perceived as credible, so the market is demanding demand/technology evidence—especially around AI DRAM/HBM momentum—before it rewards the capital-return math with a higher multiple.
Samsung 2026 shareholder return plan
KRW 90T–110T
Board-approved range, announced Aug 20, 2026
Samsung regular dividend framework
KRW 9.8T
Annual regular dividend for FY2024–2026, per company policy
Dividend component singled out for 2026
KRW 30T
Cash dividends planned for Q3 2026 (company-described structure in coverage)
Stock-buyback component singled out for 2026
KRW 15T
Buyback aimed at employee compensation (company-described structure in coverage)
What changed in the market’s model
The memory “cash mountain” trade moved from hope → underwriting
Samsung’s payout plan sits inside a broader South Korea memory narrative: investors are aware that DRAM/NAND suppliers can accumulate and then return outsized free cash flow during strong demand periods. Reuters’ framing around Aug 6 highlighted the pressure for bigger payouts as companies collectively held large net cash levels and investors argued about how much should be returned versus reinvested.
- Samsung’s plan is structured enough that investors treat it as repeatable capital discipline, not a new catalyst.
- The market instead looks for verifiable demand durability (AI servers/data-center build intensity) to sustain free cash flow into the next cycle.
- HBM/foundry-adjacent uncertainty means payouts alone can’t offset growth-risk discounting when unit economics are the driver.
In other words, the debate has shifted: the “cash-return math” is no longer the question; the question is whether the next AI-led memory upcycle is strong enough (and long enough) to keep replenishing free cash flow after aggressive capital returns.
Fundamentals cross-check (listed data)
Samsung’s cash engine can fund payouts—but investors still priced in funding capacity
From a fundamentals perspective, Samsung’s recent profitability and cash generation give it room to execute shareholder returns without stressing the balance sheet. For example, Samsung reported FY2025 net income of KRW 44.26 trillion and operating cash flow of KRW 85.32 trillion, translating into positive free cash flow of KRW 33.16 trillion (as reported in the underlying financial statements used for the figures below).
| Fiscal year (reported period end) | Revenue | Net income | Operating cash flow | Free cash flow |
|---|---|---|---|---|
| FY2025 (Dec 31, 2025) | $333.6B (KRW 333,605,938,000,000) | KRW 44.26T | KRW 85.32T | KRW 33.16T |
| FY2024 (Dec 31, 2024) | $300.9B (KRW 300,870,903,000,000) | KRW 33.62T | KRW 72.98T | KRW 21.58T |
Supply-chain lens: why capital returns can’t replace product signals
Why the payout story stops at the investor deck door
Memory is a supply/demand-driven commodity technology with sharp pricing swings. Even when a company returns cash aggressively, investors still need to be confident on three operational inputs that determine the next free-cash-flow window: (1) shipped bit growth, (2) mix shift to AI-optimized DRAM (including HBM demand indirectly), and (3) capex discipline that prevents oversupply.
Capital returns can help absorb investor preference for yield, but they can’t change the physical reality of wafer starts, yields, and supply rationalization. That’s why the market can react negatively even when the shareholder-return number is impressive.
- Samsung’s payout plan changes the cash-to-equity conversion, but not the pricing trajectory investors must underwrite.
- HBM-linked optimism competes against worries that memory pricing is nearing cycle peak, making “cash returns now” less persuasive.
- If investors think capex can’t flex down, the next quarter’s outlook dominates any long-duration yield premium from buybacks/dividends.
Peer read-through (Micron as the debate’s mirror)
Micron’s capital-allocation tone matters because it frames what ‘enough’ looks like
In the broader memory space, Micron’s shareholder-return posture acts as a reference point for whether the market expects “almost all” free cash flow to come back to shareholders or whether management retains room for capacity decisions.
Micron’s listed financials show the kind of cash generation profile that lets it fund both operating needs and capital returns during favorable demand windows.
| Fiscal year (reported period end) | Revenue | Net income | Operating cash flow | Free cash flow |
|---|---|---|---|---|
| FY2025 (Aug 28, 2025) | USD 37.38B | USD 8.54B | USD 17.53B | USD 1.67B |
| FY2024 (Aug 29, 2024) | USD 25.11B | USD 0.78B | USD 8.51B | USD 0.12B |
Horizons: what moves next
Short-term: guidance and buyback cadence. Long-term: mix and supply discipline
- In the next weeks, how fast Samsung executes the dividend/buyback components matters more than the headline range.
- In the next quarters, investors will watch whether Samsung’s free cash flow sustains at a level that makes the policy credible after the AI memory demand premium cools.
- Across 1–3 years, the decisive variable is whether Samsung can maintain mix advantage (AI-optimized DRAM/HBM relevance) while preventing supply overshoot that compresses pricing.
- A positive sign would be incremental evidence of demand strength that lets Samsung keep returning cash without sacrificing capacity control.
This is the essence of the market verdict implied by the selloff: the payout policy is not in question; the next memory cycle is.
Where this memory cash-return read-through shows up for investors
- Samsung’s board-backed 2026 return range is large, but the stock moves only if management shows free-cash-flow durability after aggressive payouts.
- Samsung’s FY2025 cash generation indicates capacity to return capital, but the market still demands pricing/mix evidence for the next cycle (near-term reaction can stay muted).
- If Samsung executes the plan smoothly while guiding demand stability, the payout policy can re-rate from ‘expected’ to ‘refreshed’ in 1–3 years.
- SK hynix’s capital-return acceleration can support sentiment, but upside depends on whether HBM-linked demand prevents free-cash-flow mean reversion in the following cycle.
- With very high profitability metrics (TTM-style profitability shown in this dataset), SK hynix has room to return cash, yet investors still discount when unit pricing confidence weakens (days–quarters).
- If SK hynix pairs buybacks with credible supply discipline, it can swing to bullish; otherwise the story stays mixed because the market treats returns as baseline defense.
- Micron’s recent free-cash-flow level is positive but volatile, so investors will judge whether capital returns scale with sustained AI demand without a new downcycle surprise (near-term).
- If Micron’s cash generation improves, it can confirm the ‘cash mountain’ thesis; if not, the market may shift from returns to cycle-risk repricing (quarters).
- Micron can benefit if capital-allocation discipline becomes a sector-wide competitive advantage and supports memory pricing power through the next 1–3 years.
- If memory makers’ AI/HBM mix supports higher wafer demand, TSMC can see steadier downstream volumes, but if investors interpret payouts as peak-cycle behavior, capex intensity could soften (quarters).
- As a foundry/advanced-node enabler, TSMC benefits from technology diffusion; however, the timing of memory investment can lag if pricing normalizes.
- The likely outcome is mixed over 1–3 years: strong AI compute supports demand, but memory-cycle volatility can create quarter-to-quarter swings.