%22%2F%3E%0A%20%20%3Ccircle%20cx%3D%22220%22%20cy%3D%22150%22%20r%3D%22180%22%20fill%3D%22%2322d3ee%22%20fill-opacity%3D%220.12%22%2F%3E%0A%20%20%3Ccircle%20cx%3D%221010%22%20cy%3D%22130%22%20r%3D%22220%22%20fill%3D%22%2338bdf8%22%20fill-opacity%3D%220.08%22%2F%3E%0A%20%20%3Ccircle%20cx%3D%22920%22%20cy%3D%22520%22%20r%3D%22170%22%20fill%3D%22%2322d3ee%22%20fill-opacity%3D%220.06%22%2F%3E%0A%20%20%3Cpath%20d%3D%22M140%20430h920%22%20stroke%3D%22url(%23line)%22%20stroke-width%3D%2212%22%20stroke-linecap%3D%22round%22%2F%3E%0A%20%20%3Cpath%20d%3D%22M220%20360c120-150%20260-220%20380-220s260%2070%20380%20220%22%20fill%3D%22none%22%20stroke%3D%22%2367e8f9%22%20stroke-opacity%3D%220.5%22%20stroke-width%3D%2216%22%20stroke-linecap%3D%22round%22%20stroke-linejoin%3D%22round%22%2F%3E%0A%20%20%3Cpath%20d%3D%22M300%20398h600%22%20stroke%3D%22%2394a3b8%22%20stroke-opacity%3D%220.24%22%20stroke-width%3D%228%22%20stroke-linecap%3D%22round%22%2F%3E%0A%20%20%3Ctext%20x%3D%22220%22%20y%3D%22510%22%20fill%3D%22%23e2e8f0%22%20fill-opacity%3D%220.7%22%20font-family%3D%22Arial%2C%20Helvetica%2C%20sans-serif%22%20font-size%3D%2238%22%20letter-spacing%3D%228%22%3EINSIGHTS%3C%2Ftext%3E%0A%3C%2Fsvg%3E)
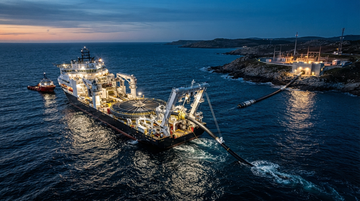
Supply-chain map (subsea → shore) meets AI interconnection reality
The “bottleneck” is not fiber—it’s installation scheduling plus shoreline termination
In AI-era cloud scaling, bandwidth demand moves from GPU clusters into a physical sequence: hyperscalers (or their network partners) contract cable systems, manufacturers build fiber and optics, and then a specialized vessel installs the cable along a route that has already been surveyed and permitted. The install window is where projects start competing directly with each other.
Two constraints matter most for investors to track: 1) installation-ship capacity (and the lead time to charter or deliver a new build), and 2) landing-station throughput (on-shore termination, beach manholes, and backhaul cross-connects).
Verified primary signal: installation fleet expansion
Prysmian is adding installation capacity—by buying time (ships), not just products (cable)
Fleet expansion plan
8 vessels
Prysmian cable-laying fleet target, as described in its vessel capacity expansion announcement.
Planned investment
€350M
Prysmian stated it will invest about €350 million in two new cable-laying assets.
Deep-water asset capacity
~19,000 tons
Prysmian described the deeper-water vessel’s total cable capacity as about 19,000 tons.
Deep-water commissioning window
2027
Prysmian described the deeper-water vessel as planned to be operational by 2027.
Prysmian’s capacity move is instructive because it tackles the installation side of the subsea chain. The company said it would increase its fleet to eight vessels by investing about €350 million in two new cable-laying assets, including a deeper-water ship with total cable capacity of about 19,000 tons and a plan for it to be operational by 2027.
That structure—capital expenditure on ships with multi-year timelines—mirrors what hyperscalers face: even if a cable system is “ready” in manufacturing terms, it can still miss an availability window for installation slots.
Vessel physics and constraints (tons-on-deck) shape AI rollout timing
A small fleet installs a large share of global cable—so each charter delays others
Cable-laying vessels are specialized by purpose and capability. The International Cable Protection Committee’s (ICPC) public “cableships of the world” catalog illustrates that even among repair/lay-capable ships, cable capacity varies widely by vessel.
For example, ICPC lists vessels with repair/lay capability and cable capacity ranging from hundreds to thousands of tons. That spread matters because project planning for hyperscalers is effectively a portfolio optimization problem: routes, burial methods, and weather windows combine with vessel availability to determine when bandwidth can enter service.
| Vessel (ICPC list) | Purpose (ICPC) | Cable capacity |
|---|---|---|
| IT Infinity | Lay / Repair | 2,000 tonnes |
| Telepaatti | Lay, Survey & Repair | 250 tons |
| IT Intrepid | Repair / Lay / Remedial | 1,700 tonnes |
| Ile de Batz | Lay / Repair | 5,500 tons |
Shore-side linkage: landing stations turn submarine routes into usable network capacity
Subsea cables are only half the job; the shore is an equally real interface
On shore, a subsea cable system terminates at a cable landing station (CLS). A CLS is the physical facility where undersea cables come ashore and are connected onward to terrestrial networks (backhaul, switching, and routing).
This is where capacity constraints can show up as delays and engineering bottlenecks: even if an offshore route is complete, the cable can’t fully monetize without termination readiness—fiber splicing, line terminal equipment readiness, and integration into existing backhaul.
A CLS is an onshore facility responsible for taking data from a subsea cable and connecting it to terrestrial networks.
China and “trusted supply” pressures: the manufacturing side can also gate timing
Import restrictions and “trusted supply” policies can re-route material and component flows
While ship scheduling is the headline bottleneck, component and materials supply can become the upstream constraint that determines how many qualified systems can be delivered for installation.
In parallel, policy attention on undersea cable supply chains—particularly with respect to China exposure—has been rising across multiple jurisdictions. The practical effect for investors is that the subsea chain can become more regionalized: more localization, more “trusted” qualification, and more administrative lead time.
Who captures margin as AI traffic compounds?
Margin shifts toward the interface: installation assets, integration services, and resilience/operations
- Cable makers capture margin on manufacturing and systems design; but installation windows can decide whether that margin gets realized quickly or deferred into later project years.
- Vessel owners and operators capture margin through charter economics and higher utilization when project calendars overlap.
- Cable landing infrastructure operators and integration ecosystems can monetize “availability” by reducing termination downtime and improving commissioning speed.
- Resilience and repair workflows become increasingly valuable because higher traffic volumes raise the cost of outages—linking cyber-physical risk to recurring service economics.
The supply-chain implication for AI is that bandwidth growth is not just a capacity curve—it’s a timeline curve. Investors should look for companies that can either (1) secure installation scheduling and qualify systems fast, or (2) provide operational continuity and fast restoration.
Investor-grade fundamentals for listed “picks and shovels”
How to think about listed plays when the constraint is subsea build timing
Prysmian (installers of subsea-ready systems)
Gross margin ~26.7%
Latest available trailing gross margin is shown in the company overview dataset.
Prysmian (profitability)
EBIT margin ~9.6%
Latest available trailing EBIT margin is shown in the company overview dataset.
NEC (network + systems integration exposure)
Gross margin ~33.5%
Latest available trailing gross margin is shown in the company overview dataset.
NEC (operating profitability)
Operating margin ~11.2%
Latest available trailing operating margin is shown in the company overview dataset.
Horizons: what moves first vs. what compounds
Short-term catalysts are ship availability and commissioning; long-term is structural substitution
- In coming quarters, watch for commentary on cable project execution timing—whether new ship capacity and route planning reduces slippage for hyperscaler-connected builds.
- In days-to-months, the “first-order” driver is charter/utilization and commissioning readiness at key landing points; it’s visible through project updates more than through broad subsea telecom demand headlines.
- Over 1–3 years, structural procurement shifts toward “trusted” supply and greater regionalization can expand qualified vendor lists—but also add qualification lead time.
- If hyperscalers broaden private cable footprints, recurring margin can shift from pure transit to ownership-linked services and higher-value integration.
Listed equity angles that map to the installation/termination bottleneck
- Prysmian’s plan to invest about €350 million and expand to eight cable-laying vessels supports faster installation throughput as AI-driven projects overlap (Prysmian announcement).
- A deeper-water vessel planned with ~19,000 tons of cable capacity can reduce “ship-slot” scarcity if utilization stays high (Prysmian announcement).
- By 2027, delivery of new assets can shorten the delivery lag from contract to commissioning versus a world with only legacy fleet capacity (Prysmian announcement).
- NEC’s reported network/system integration footprint can benefit from faster shore-side termination and integration when subsea build cycles accelerate (company overview shows NEC’s network/system role).
- If subsea build timing becomes constrained by installation ships, NEC’s revenue conversion can face timing offsets even as project demand rises (it depends on customer commissioning windows).
- Over 1–3 years, qualification and integration work can shift toward vendors that can deploy quickly alongside new private subsea footprints (market-structure inference; limited direct filing evidence here).
- Subsea 7’s offshore engineering/installation exposure can track subsea project execution volumes when AI-driven interconnection expands the build calendar (company overview describes offshore projects and installation).
- If maintenance and repair demand rises with higher utilization, Subsea 7 can capture more recurring intervention work (ICPC repair/lay-capable vessel context supports more activity).
- In the next 1–3 years, higher utilization can raise project visibility for offshore contractors, but execution risk remains material (ship scheduling and weather constraints).
- Teledyne’s marine-environment instrumentation and marine monitoring exposure can benefit from more subsea build and repair activity (company overview describes marine/instrumentation use).
- As subsea projects increase, instrumentation demand can shift from “nice to have” to commissioning-critical measurement and monitoring (market-structure inference; no direct subsea metric in this research set).
- The key catalyst to watch is whether customers expand monitoring budgets alongside subsea rollouts in the next few quarters (needs company-specific contract disclosures).