%22%2F%3E%0A%20%20%3Ccircle%20cx%3D%22220%22%20cy%3D%22150%22%20r%3D%22180%22%20fill%3D%22%2322d3ee%22%20fill-opacity%3D%220.12%22%2F%3E%0A%20%20%3Ccircle%20cx%3D%221010%22%20cy%3D%22130%22%20r%3D%22220%22%20fill%3D%22%2338bdf8%22%20fill-opacity%3D%220.08%22%2F%3E%0A%20%20%3Ccircle%20cx%3D%22920%22%20cy%3D%22520%22%20r%3D%22170%22%20fill%3D%22%2322d3ee%22%20fill-opacity%3D%220.06%22%2F%3E%0A%20%20%3Cpath%20d%3D%22M140%20430h920%22%20stroke%3D%22url(%23line)%22%20stroke-width%3D%2212%22%20stroke-linecap%3D%22round%22%2F%3E%0A%20%20%3Cpath%20d%3D%22M220%20360c120-150%20260-220%20380-220s260%2070%20380%20220%22%20fill%3D%22none%22%20stroke%3D%22%2367e8f9%22%20stroke-opacity%3D%220.5%22%20stroke-width%3D%2216%22%20stroke-linecap%3D%22round%22%20stroke-linejoin%3D%22round%22%2F%3E%0A%20%20%3Cpath%20d%3D%22M300%20398h600%22%20stroke%3D%22%2394a3b8%22%20stroke-opacity%3D%220.24%22%20stroke-width%3D%228%22%20stroke-linecap%3D%22round%22%2F%3E%0A%20%20%3Ctext%20x%3D%22220%22%20y%3D%22510%22%20fill%3D%22%23e2e8f0%22%20fill-opacity%3D%220.7%22%20font-family%3D%22Arial%2C%20Helvetica%2C%20sans-serif%22%20font-size%3D%2238%22%20letter-spacing%3D%228%22%3EINSIGHTS%3C%2Ftext%3E%0A%3C%2Fsvg%3E)
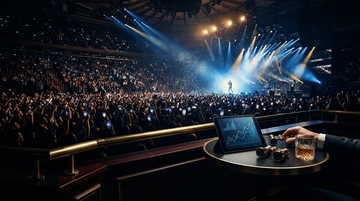
Earnings: venue/operator capture vs. artist capture
MSGE’s Q2 reads like pricing power showing up as mix—not just as more shows
Live entertainment stopped being a post-pandemic rebound story and started looking like a market-structure story: capacity is finite, and the highest-quality venues can monetize scarcity through better show economics and attendance mix. In its fiscal Q2 2026 update, MSGE highlighted stronger entertainment performance and profit improvement, giving investors a direct line from “concert demand” to “venue/operator capture” rather than a pure rebound bounce.
The key takeaway for investors: the “operator” wins when scarcity compresses alternatives, because the venue controls the supply of attention (and the customer funnel) in a way artists can’t.
Revenue (Q2 FY2026)
$459.9M
Fiscal 2026 second quarter reported Feb 3, 2026
Entertainment revenues (Q2 FY2026)
$360.5M
Fiscal 2026 second quarter reported Feb 3, 2026
Entertainment revenue growth (YoY)
+13%
Fiscal 2026 second quarter reported Feb 3, 2026
What happened in Q2 and what it implies
Concert demand strengthened—and operators benefited from the mix, not only volume
A scarcity regime should show up in two places: (1) more people willing to attend the shows you have, and (2) better revenue per concert/show day. In the Q2 results, MSGE described entertainment revenue improvement driven by concerts and venue performance.
For the operator thesis, what matters is whether revenue growth comes from “more units” (more concerts) or “better units” (higher per-event revenue / better attendance mix). The company’s commentary in the quarter emphasizes venue/concert performance drivers, which aligns with operator capture: the venue is the bottleneck.
| Metric | Reported value | Where it appears |
|---|---|---|
| Total revenue | $459.9M | Fiscal 2026 Q2 results press release (reported Feb 3, 2026) |
| Entertainment revenues | $360.5M | Fiscal 2026 Q2 results press release (reported Feb 3, 2026) |
| Entertainment revenues growth (YoY) | +13% | Fiscal 2026 Q2 results press release (reported Feb 3, 2026) |
Follow-through: profitability and cash quality matter after “volume”
The “survived normalization” claim holds only if profit quality keeps up
Live-entertainment monetization is not just about top-line growth—it has to convert into operating profitability and withstand cost normalization. When costs normalize after the pandemic, you only keep “monetization” if revenue quality offsets cost pressure.
On the broader fundamentals read-through for MSGE, the most visible signal is how earnings and cash generation behave over fiscal years, even when quarterly results are mixed. Across FY2024–FY2026, the company shows variability that investors should treat as a risk factor: operators win on scarcity, but they still face event-cycle timing and cost swings.
MSGE: net income and cash flow direction across recent fiscal years
Use as a durability check for the monetization thesis (annual figures).
Unit: USD
FY2024 net income
144,300,000
FY2025 net income
37,431,000
FY2026 net income
-38,327,000
FY2024 operating cash flow
111,266,000
FY2025 operating cash flow
115,297,000
FY2026 operating cash flow
102,583,000
Supply chain view: where the money stays when seats are scarce
Scarcity shifts bargaining power along the live stack—venue operators keep more
In a scarcity environment, the economics flow to whoever controls the scarce constraint. In live entertainment, that constraint is typically venue inventory plus ticket-distribution leverage.
Upstream, artists and promoters can chase demand, but they can’t create more high-status dates without paying higher booking and production costs. Downstream, fans still need a trusted pathway to buy and attend—so the operator/inventory-holder captures more margin through ticketing fees, concessions/onsite monetization, and venue-level brand.
This is why investors should compare operator revenue/margin outcomes against competitors that depend more on ad-supported media or non-venue formats.
- Venue bottlenecks can turn “more demand” into higher revenue per show day even when show counts are stable.
- Ticketing and distribution scale can keep fee revenue resilient when attendance normalizes rather than expands.
- Operator advantage is most visible when company commentary links growth to venue performance rather than only to aggregate touring activity.
What investors should watch next
The next quarter(s) decide whether this is a one-off calendar lift or a new capture regime
The thesis that scarcity benefits operators works only if it repeats. In the near term, the signal is whether entertainment revenue growth continues and whether the company’s commentary ties improvement to ongoing concert/venue strength.
Over a 1–3 year horizon, investors should watch for: (1) sustained profitability conversion (net income volatility would undercut the “monetization survived” angle), (2) capital allocation aligned with venue/event growth, and (3) whether competitive pressures (ticketing/venue utilization and production costs) erode margins.
A key limitation here: the “concert volumes doubled” claim in the prompt wasn’t verifiably confirmed in the primary source excerpts available during this run, so this article anchors on what the company actually disclosed for Q2 revenue and entertainment performance.
Listed names that represent the live-inventory transmission path
- Live Nation’s Q2 results show concert-led momentum, with attendance up and concert revenue rising, which supports the broader scarcity capture trade.
- Ticketing scale and fee-bearing volume can hold up in normalization when attendance stabilizes rather than grows explosively.
- Monitor fee-bearing ticket volume and concert revenue trends over the next 1–2 quarters for confirmation.