%22%2F%3E%0A%20%20%3Ccircle%20cx%3D%22220%22%20cy%3D%22150%22%20r%3D%22180%22%20fill%3D%22%2322d3ee%22%20fill-opacity%3D%220.12%22%2F%3E%0A%20%20%3Ccircle%20cx%3D%221010%22%20cy%3D%22130%22%20r%3D%22220%22%20fill%3D%22%2338bdf8%22%20fill-opacity%3D%220.08%22%2F%3E%0A%20%20%3Ccircle%20cx%3D%22920%22%20cy%3D%22520%22%20r%3D%22170%22%20fill%3D%22%2322d3ee%22%20fill-opacity%3D%220.06%22%2F%3E%0A%20%20%3Cpath%20d%3D%22M140%20430h920%22%20stroke%3D%22url(%23line)%22%20stroke-width%3D%2212%22%20stroke-linecap%3D%22round%22%2F%3E%0A%20%20%3Cpath%20d%3D%22M220%20360c120-150%20260-220%20380-220s260%2070%20380%20220%22%20fill%3D%22none%22%20stroke%3D%22%2367e8f9%22%20stroke-opacity%3D%220.5%22%20stroke-width%3D%2216%22%20stroke-linecap%3D%22round%22%20stroke-linejoin%3D%22round%22%2F%3E%0A%20%20%3Cpath%20d%3D%22M300%20398h600%22%20stroke%3D%22%2394a3b8%22%20stroke-opacity%3D%220.24%22%20stroke-width%3D%228%22%20stroke-linecap%3D%22round%22%2F%3E%0A%20%20%3Ctext%20x%3D%22220%22%20y%3D%22510%22%20fill%3D%22%23e2e8f0%22%20fill-opacity%3D%220.7%22%20font-family%3D%22Arial%2C%20Helvetica%2C%20sans-serif%22%20font-size%3D%2238%22%20letter-spacing%3D%228%22%3EINSIGHTS%3C%2Ftext%3E%0A%3C%2Fsvg%3E)
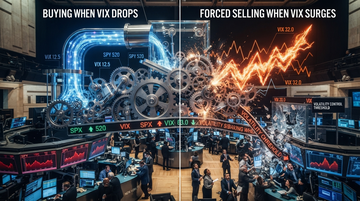
The verified headline mechanism: cash, then a thin marginal-buyer stack
The “risk complex” rally is getting liquidity, but the marginal bid looks mechanical—not broad-based
Bloomberg framed an Aug 2026 move as a fresh “risk complex” surge powered by a “deluge of fresh cash.” While discretionary investors usually smooth rallies over time, systematic volatility-linked strategies can create step-function demand that appears in calm tape and disappears during stress.
The key implication for investors: the rally’s durability depends less on fundamentals in the next few days and more on whether volatility-control/CTA-type flows keep behaving like buyers or flip into sellers.
Verified flow behavior and scale (from primary research access)
Volatility-control funds are large enough to move markets—and they trade opposite to turbulence
Mode of action
Buy when calmer, sell when turbulent
Reuters describes automated volatility control funds as often buying when VIX drops and dumping when it surges.
Scale proxy
~$700B AUM (Reuters/UBS cited)
Reuters (Jun 26, 2025) reports automated volatility control funds run about $700B of assets.
Reuters (citing UBS) gives a crucial structural detail: automated volatility control funds are typically designed to buy equities when volatility is low and reduce/sell when volatility rises. That means a “cash deluge” can translate into higher risk prices quickly—until the volatility trigger regime changes.
In that regime shift, the strategy’s internal rules can cause selling that is not discretionary. That is the fragility test: the market can look well-supported while the marginal buyers are actually conditioned to exit.
Event-linked selling pressure evidence (documented magnitude, even if from a prior episode)
Volatility-linked strategies have already shown they can dump meaningful size quickly
| Source episode (Reuters) | What moved | Magnitude cited | Speed/behavioral takeaway |
|---|---|---|---|
| Aug 6, 2024 (selling may be easing) | Volatility-linked funds selling flows | ~$150B over ~3 weeks | Demonstrates scale of mechanical selling can be large enough to matter. |
| Aug 2, 2024-style referenced tape (related Reuters entry) | Immediate selling on selloff day | ~$70B in stocks offloaded during a Monday selloff (per Reuters chunk) | Shows the action can be concentrated around sharp tape changes. |
You shouldn’t treat those earlier figures as the exact Aug 2026 “cash deluge” totals (the sources accessed here are from 2024/2025 Reuters articles). But the investor-relevant property is consistent: volatility-linked strategies can re-allocate quickly when the volatility condition flips.
That’s why a rally driven by inflows can still be fragile if the marginal demand is concentrated in rule-driven systems.
Supply-chain aware: the chain from options/vol triggers to funding to liquidity provision
Full transmission chain: volatility triggers → systematic equity futures demand → dealer hedging → liquidity/market depth
- Volatility-control and related trend systems recalibrate equity exposure when VIX/vol levels move, changing futures buy/sell pressure.
- That pressure forces dealers to hedge faster, compressing quoted depth and widening bid/ask during regime transitions.
- If cash inflows are the “visible” story, the “hidden” driver is whether vol-linked strategies continue to net-buy or net-sell through the next volatility test.
Fundamentals overlay: why this still matters even in an index-led world
Why index-level optimism can coexist with microstructure fragility
Even if the macro narrative improves, an index rally can be powered by liquidity that is not permanently committed. If volatility is low, volatility-control systems tend to add exposure; if volatility rises, they can subtract.
So “good days” can be self-reinforcing: low vol → mechanical buying → tighter spreads → even more price support. But when the regime changes, the same mechanics can work in the opposite direction, making downside move faster than upside.
Investor playbook: what to watch next (data you can check repeatedly)
Three indicators that answer the fragility question faster than any narrative
- Check whether volatility-linked funds remain net-buying by monitoring whether VIX/vol triggers stay in the “calm” band for multiple sessions.
- Watch whether options market liquidity and dealer hedging costs worsen—if spreads widen quickly, flow fragility is likely increasing.
- Confirm whether broad ETF/index inflows keep matching the risk complex’s outperformance; if flows stall while vol rises, mechanical buyers may be exiting.
Related listed beneficiaries/victims (where the mechanism touches public equity)
Where investors can express the trade: venues that monetize volatility + dealers that intermediate it
This event’s mechanism touches market infrastructure more directly than it touches one specific “AI winner.” Volatility-linked systematic activity tends to raise demand for hedging, trading, and derivatives infrastructure—benefiting exchange/clearing operators.
Below are listed names where the cash-to-vol-to-liquidity chain has a plausible, evidence-based linkage.
Investable linkage candidates (listed only)
- Higher systematic participation can increase derivatives usage that drives exchange revenue over coming quarters (consistent with the volatility-linked flow mechanism).
- In days–quarters, volatility regime shifts can raise hedging turnover in index futures/options—a direct demand channel.
- Over 1–3 years, persistent volatility-control/CTA adoption can support structurally higher market activity if risk management remains rules-based.
- In days–quarters, volatility-linked regime flips can increase trading/market-making activity, which can be a near-term earnings tailwind.
- In the downside tail, the same flips can widen balance-sheet/liquidity pressure, increasing risk costs when volatility rises fast.
- Over 1–3 years, if systematic flow share remains high, Citigroup can keep participating in market liquidity provision—but credit/risk sensitivities remain the main swing factor.
- If volatility stays calm, volatility-control mechanics can support sustained index bid via systematic exposure.
- If volatility rises, mechanical selling can reduce near-term downside cushioning because the marginal bid fades quickly.
- Over 1–3 years, SPY performance remains fundamentals-led, but this event’s focus is whether near-term flow-driven moves persist or revert.
- Reuters explicitly ties UBS to the $700B volatility-control fund scale estimate—so UBS may benefit from persistent systematic flows where it operates in asset/wealth/advisory.
- In days–quarters, if volatility control rules flip, UBS trading risk can rise through market volatility even if volumes increase.
- Over 1–3 years, structural adoption of volatility targeting can increase fee opportunities, but market-risk sensitivity remains the key uncertainty.