%22%2F%3E%0A%20%20%3Ccircle%20cx%3D%22220%22%20cy%3D%22150%22%20r%3D%22180%22%20fill%3D%22%2322d3ee%22%20fill-opacity%3D%220.12%22%2F%3E%0A%20%20%3Ccircle%20cx%3D%221010%22%20cy%3D%22130%22%20r%3D%22220%22%20fill%3D%22%2338bdf8%22%20fill-opacity%3D%220.08%22%2F%3E%0A%20%20%3Ccircle%20cx%3D%22920%22%20cy%3D%22520%22%20r%3D%22170%22%20fill%3D%22%2322d3ee%22%20fill-opacity%3D%220.06%22%2F%3E%0A%20%20%3Cpath%20d%3D%22M140%20430h920%22%20stroke%3D%22url(%23line)%22%20stroke-width%3D%2212%22%20stroke-linecap%3D%22round%22%2F%3E%0A%20%20%3Cpath%20d%3D%22M220%20360c120-150%20260-220%20380-220s260%2070%20380%20220%22%20fill%3D%22none%22%20stroke%3D%22%2367e8f9%22%20stroke-opacity%3D%220.5%22%20stroke-width%3D%2216%22%20stroke-linecap%3D%22round%22%20stroke-linejoin%3D%22round%22%2F%3E%0A%20%20%3Cpath%20d%3D%22M300%20398h600%22%20stroke%3D%22%2394a3b8%22%20stroke-opacity%3D%220.24%22%20stroke-width%3D%228%22%20stroke-linecap%3D%22round%22%2F%3E%0A%20%20%3Ctext%20x%3D%22220%22%20y%3D%22510%22%20fill%3D%22%23e2e8f0%22%20fill-opacity%3D%220.7%22%20font-family%3D%22Arial%2C%20Helvetica%2C%20sans-serif%22%20font-size%3D%2238%22%20letter-spacing%3D%228%22%3EINSIGHTS%3C%2Ftext%3E%0A%3C%2Fsvg%3E)
As of July 19, 2026
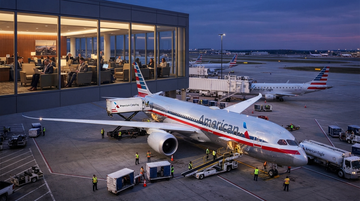
American Airlines CEO Robert Isom has set out a long-range plan to close the carrier’s profit gap with United Airlines and Delta Air Lines. The program combines premium cabins, lounges, fleet investment, schedule redesign, loyalty growth and network expansion. The direction is strategically coherent—but American’s starting point makes this much more than a product refresh.
The central finding is stark: American’s 2025 revenue was only 7.5% below United’s, yet its net income was 96.7% lower. Relative to Delta, American generated 86.2% as much revenue but only 2.2% as much net income. That is evidence of a system-wide monetization and cost-of-capital problem, not merely insufficient scale.
AAL 2025 net income
$111M
Versus $3.35B at United and $5.01B at Delta
AAL 2025 operating margin
2.7%
$1.47B operating income on $54.63B revenue
AAL TTM net income
$202M
Through the latest reported quarter, March 31, 2026
AAL total debt
$34.9B
Latest reported balance-sheet snapshot
2025 peer profit deficit
$3.24B
American’s GAAP net-income deficit versus United
Next hard checkpoint
July 23
Scheduled Q2 2026 earnings webcast at 7:30 a.m. CT
In a July 19 CNBC report, Isom described a long-range effort to make American “best at everything that we do” and said the plan is aimed at making up its margin gap with rivals. CNBC quantified the 2025 GAAP net-income deficits at roughly $3.2 billion versus United and $4.9 billion versus Delta.
The announced operating agenda includes:
- growing AAdvantage and premium-seat revenue;
- refreshing Boeing 777 cabins and selecting additional wide-body aircraft from Boeing or Airbus;
- expanding Admirals Club and premium ground facilities at Dallas/Fort Worth;
- deploying Starlink connectivity;
- redesigning schedules and hub banks to improve reliability; and
- expanding local hub share and American’s global network.
The report did not identify a deadline for closing the gap. Accordingly, “$3 billion” should be treated as a directional competitive benchmark, not formal earnings guidance.
What we will measure over time is: Are we closing this revenue gap and closing the unit revenue gap?
That wording matters. Management is framing the problem first as a revenue-quality and unit-revenue deficit, rather than as a simple cost-cutting target. It implies that American believes its network has enough physical scale but does not extract enough revenue from each unit of capacity.
| Company | Revenue | Operating income | Operating margin | Net income | Free cash flow |
|---|---|---|---|---|---|
| American (AAL) | $54.63B | $1.47B | 2.7% | $111M | -$680M |
| United (UAL) | $59.07B | $4.71B | 8.0% | $3.35B | $2.56B |
| Delta (DAL) | $63.36B | $5.82B | 9.2% | $5.01B | $3.84B |
2025 GAAP net income
American earned a small fraction of the profits generated by its two principal network-carrier peers.
Unit: $ billions
American
$111 million
0.1
United
$3.353 billion
3.4
Delta
$5.005 billion
5
The gap is larger than the difference in airline size. American’s 2025 revenue trailed United by $4.44 billion, but its operating income trailed by $3.25 billion. In other words, about 73 cents of every dollar in the revenue difference also appeared in the operating-profit difference.
This does not mean incremental airline revenue normally carries a 73% margin. It means the two firms’ entire revenue-and-cost systems operated at radically different profitability levels. American cannot close the gap merely by adding low-yield seats: added capacity also brings fuel, labor, airport, maintenance and ownership costs. It must improve the yield and loyalty contribution of existing capacity while limiting the cost required to deliver the upgraded product.
American’s revenue rose from $52.79 billion in 2023 to $54.63 billion in 2025, but operating income fell by more than half and net income dropped to $111 million. The decline was not caused by an absence of passengers alone; revenue grew while profitability deteriorated.
The first quarter of 2026 showed the same tension. Revenue reached a record $13.91 billion, up 10.8% year over year, and passenger yield rose 5.6%. Yet operating expenses exceeded revenue, producing a $41 million operating loss and a $382 million GAAP net loss.
| Fiscal year | Revenue | Operating income | Operating margin | Net income | Free cash flow | Total debt |
|---|---|---|---|---|---|---|
| 2023 | $52.79B | $3.03B | 5.7% | $822M | $1.21B | $40.66B |
| 2024 | $54.21B | $2.61B | 4.8% | $846M | $1.30B | $37.54B |
| 2025 | $54.63B | $1.47B | 2.7% | $111M | -$680M | $35.97B |
| TTM through Q1 2026 | $55.99B | $1.70B | 3.0% | $202M | $1.10B | $34.89B |
American operating-margin compression
Calculated from reported GAAP revenue and operating income.
Unit: %
2023
5.8%
2024
4.8%
2025
2.7%
TTM Q1 2026
3%
American’s Q1 total revenue per available seat mile increased 7.6%, but cost per available seat mile rose 5.6%. The resulting 19.32 cents of TRASM remained below 19.38 cents of CASM. Revenue improvement therefore had not yet crossed the threshold into operating profitability.
Fuel also re-emerged as a major external pressure: American paid an average $2.75 per gallon in Q1, up 10.7% year over year, and fuel expense rose 13.2% to $2.93 billion. Management said its full-year guidance midpoint was approximately flat with 2025 despite an expected $4 billion increase in jet-fuel expense. That is a meaningful mitigation claim—but flat earnings would still leave the structural peer gap largely intact.
| Metric | Q1 2026 | Year-over-year change | Interpretation |
|---|---|---|---|
| Operating revenue | $13.91B | +10.8% | Record first-quarter revenue |
| Operating income | -$41M | Improved from -$270M | Revenue still did not cover operating expense |
| GAAP net income | -$382M | Improved from -$473M | Interest and other costs remained material |
| TRASM | 19.32¢ | +7.6% | Strong unit-revenue recovery |
| CASM | 19.38¢ | +5.6% | Still above TRASM |
| Passenger yield | 21.34¢ | +5.6% | Better pricing/mix |
| Other revenue | $1.20B | +23.9% | Loyalty and ancillary contribution |
| Managed corporate revenue | Not disclosed in dollars | +13% | Commercial-account recovery |
| AAdvantage enrollments | Not disclosed in members | +25% | Funnel growth, but not yet proof of durable profit |
| Co-brand card spend | Not disclosed in dollars | +9% | Positive loyalty indicator |
The turnaround has four linked economic engines. None is sufficient alone.
American plans more lie-flat and premium-economy seats, refreshed Boeing 777 cabins, larger lounges and premium check-in. Premium seats can carry much higher absolute fares than economy—CNBC cited international business-class prices of up to $10,000 versus $2,000 or less for economy—but those figures are illustrative fares, not disclosed systemwide averages.
The economic mechanism is:
better cabins and ground experience → higher willingness to pay and more paid upgrades → higher passenger yield and unit revenue → greater contribution from existing flights.
American reported that premium unit revenue outperformed Main Cabin in Q1 and that managed corporate revenue rose 13%. Those are encouraging leading indicators, but management has not disclosed the dollar amount of premium revenue or the incremental margin on cabin retrofits. Investors therefore cannot yet calculate a verified return on the premium capital program.
AAdvantage is already economically significant. American recognized $4.04 billion of loyalty travel revenue and $3.51 billion of loyalty marketing revenue in 2025—$7.55 billion combined, or 13.8% of total company revenue. That figure is a revenue classification, not a standalone loyalty segment profit.
The new 10-year Citi arrangement makes Citigroup the exclusive issuer of American’s U.S. co-branded cards beginning in 2026. Q1 cash received from loyalty partners rose to $2.9 billion from $1.8 billion, although the 2026 amount included a one-time payment connected to the partner extension. Consequently, annualizing Q1 would materially overstate the recurring run rate.
Loyalty-related revenue
$7.55B
2025 travel plus marketing components
Share of AAL revenue
13.8%
Calculated from $7.55B and $54.63B total revenue
Partner cash, Q1 2026
$2.9B
Included a nonrecurring extension payment
Loyalty liability
$10.56B
Deferred obligation for future rewards at year-end 2025
| Carrier | Disclosed loyalty measure | 2025 amount | Important caveat |
|---|---|---|---|
| American | Travel revenue plus marketing revenue | $7.55B | Not a disclosed segment profit |
| United | Other operating revenue from partner agreements | $3.2B | Excludes some travel-award economics |
| Delta | American Express cash sales | $8.0B | Cash sales are not the same as GAAP revenue |
The table should not be used as a ranking because each airline discloses a different measure. It does, however, show the structural issue: competitors also possess powerful card ecosystems. Delta’s relationship with American Express generated $8.0 billion of cash sales in 2025, while United’s filing disclosed $3.2 billion of partner-related other revenue. American is not introducing an uncontested advantage; it is trying to narrow a loyalty-monetization gap against entrenched programs.
American’s 2025 passenger-revenue base was heavily domestic: $35.20 billion, or 70.9% of passenger revenue. Latin America and Atlantic passenger revenue contributed $6.44 billion and $6.58 billion, respectively, while Pacific revenue was $1.41 billion.
Management is targeting more local hub share in Philadelphia, Miami and Phoenix, investments at Miami’s Concourse D, and rebanking at Dallas/Fort Worth and Philadelphia. The intended chain is:
more locally relevant schedules and tighter connection banks → higher itinerary utility → more corporate and premium demand → higher load factor/yield without indiscriminate capacity growth.
But tighter banks also concentrate aircraft, crews, bags and passengers into short windows. If ground operations are under-resourced, the same strategy can amplify disruption rather than improve it. Reliability is therefore not a separate operational objective; it is a prerequisite for premium pricing.
American 2025 passenger revenue by geography
Unit: $ billions
Domestic
35.2
Atlantic
6.6
Latin America
6.4
Pacific
1.4
The Association of Professional Flight Attendants cited American’s last-place overall ranking in the Wall Street Journal’s 2025 airline scorecard, bottom-three results in several operating categories, and last place in an October 2025 J.D. Power satisfaction study. Those rankings are union-cited evidence rather than disclosures in American’s filings, but they help explain the economic mechanism behind the margin gap.
A traveler will pay a premium only if the entire journey is dependable. A lie-flat seat cannot compensate for a canceled flight, missed connection or mishandled bag. Reliability affects:
- reaccommodation and customer-care expense;
- aircraft and crew utilization;
- corporate-account retention;
- willingness to pay for premium products; and
- employee workload and morale.
This makes operational consistency a monetization lever, not just a service metric.
American has reduced total debt from $46.18 billion at the end of 2021 to $34.89 billion at the latest snapshot—a reduction of $11.29 billion. Q1 results described total debt as the lowest since mid-2015. Yet the company still carried more total debt than either United or Delta on the latest reported data, despite generating far less profit.
The most important distinction is between liquidity and financial flexibility. American reported $10.8 billion of total available liquidity at March 31, including undrawn facilities. That protects near-term operations, but it does not eliminate interest expense, principal maturities or aircraft commitments.
American total debt reduction
Year-end balances, with the latest point at Q1 2026.
Unit: $ billions
2021
46.2
2022
43.7
2023
40.7
2024
37.5
2025
36
Q1 2026
34.9
| Company | Total debt | Net debt | Stockholders’ equity | Interest coverage |
|---|---|---|---|---|
| American | $34.89B | $33.99B | -$4.08B | 1.9x |
| United | $33.67B | $23.50B | $16.70B | 3.8x |
| Delta | $19.98B | $15.32B | $21.82B | 8.9x |
American’s debt structure magnifies small operating disappointments. At year-end 2025, 47% of long-term debt carried variable rates. The 10-K estimated that a 100-basis-point rate increase would raise annual interest expense by about $130 million while increasing interest income by about $60 million—a net sensitivity of roughly $70 million before tax. That is large relative to 2025 net income of $111 million.
Similarly, the company estimated that each one-cent change in fuel price per gallon would alter 2026 fuel expense by approximately $50 million. A 20-cent adverse move would therefore imply about $1 billion of added expense, all else equal. These sensitivities show why American needs a larger recurring earnings cushion before its turnaround can be considered durable.
American’s strategy depends on a broad industrial and commercial ecosystem. Upstream manufacturers determine whether promised cabins and capacity arrive on time; engine makers affect fuel efficiency and maintenance availability; card and airline partners determine loyalty reach; corporate travelers and premium leisure passengers determine whether the investment earns an adequate return.
| Position | Entity | Ticker | Documented linkage | Investment relevance |
|---|---|---|---|---|
| Upstream airframe | Airbus | EADSY | American had 161 A320-family purchase commitments at Q1 2026 | Deliveries support upgauging and premium-seat growth; delays defer revenue benefits |
| Upstream airframe | Boeing | BA | American had commitments for 120 737-family and 19 787-family aircraft | Wide-body and MAX availability affect network and fleet economics |
| Upstream airframe | Embraer | ERJ | American had 78 E175 commitments at Q1 2026 | Larger dual-class regional jets support feed and first-class capacity |
| Upstream engines/services | CFM International / GE Aerospace and Safran | GE / SAF.PA | LEAP-1A engines and long-term maintenance selected for future A321neos | Fuel efficiency and engine availability influence CASM and utilization |
| Downstream loyalty/distribution | Citigroup | C | Exclusive U.S. AAdvantage co-brand issuer from 2026 under a 10-year agreement | Card acquisition and spend are central to loyalty cash generation |
| Downstream airline partner | Alaska Air Group | ALK | Oneworld partner supporting mileage earning, redemption and network reach | Expands customer utility beyond American-operated flights |
| Downstream airline partner | British Airways / IAG | IAG.L | Oneworld partner and part of American’s transatlantic network ecosystem | Adds international destinations and redemption utility |
| Downstream demand | Corporate and premium travelers | Not applicable | Managed corporate revenue rose 13% in Q1 2026 | Primary customer pool required to monetize premium investment |
American’s Q1 filing listed 378 aircraft purchase commitments: 161 A320-family aircraft, 120 737-family aircraft, 19 Boeing 787-family aircraft and 78 Embraer E175s. The order book creates long-duration revenue and service opportunities for Airbus, Boeing, Embraer and engine providers.
CFM International—a 50/50 venture between GE Aerospace and Safran—was selected to power future Airbus A321neo deliveries with LEAP-1A engines and provide long-term maintenance. American’s announcement said LEAP engines offer 15% better fuel efficiency and 15% lower carbon emissions than the prior-generation CFM56. Those are manufacturer/company claims, and actual airline savings depend on utilization, fuel prices, maintenance intervals and fleet deployment.
For investors in suppliers, American’s turnaround is supportive but unlikely to be individually transformative because each manufacturer serves many customers. For American, however, supplier execution is critical. A delayed aircraft or constrained engine is not just postponed capital spending; it can also postpone premium-seat growth, increase dependence on older aircraft and prevent expected fuel savings.
Aircraft commitments
378
American’s Q1 2026 filing
A320 family
161
Purchase commitments
737 family
120
Purchase commitments
E175
78
Purchase commitments
787 family
19
Purchase commitments
Q1 capital expenditure
$811M
Three months ended March 31, 2026
Citi is the most economically direct downstream linkage because card spend converts consumer engagement into partner cash and loyalty revenue. Airline partners such as Alaska Airlines and British Airways broaden AAdvantage’s destination and redemption network, improving the perceived utility of each mile.
That utility can create a flywheel:
more destinations and premium rewards → more card acquisition and spend → more partner cash → more customer investment → stronger traveler preference.
The reverse is also possible. If award availability weakens or operating reliability deteriorates, miles become less valuable to customers, reducing the differentiation of the card proposition. Loyalty therefore cannot be fully separated from the quality of the airline operation.
Union pressure intensified after American’s weak 2025 result. Reuters reported that APFA issued a unanimous no-confidence vote in Isom and that pilots requested a meeting with the full board. The unions linked poor profitability to reduced employee profit sharing and operational underperformance.
This is not simply a governance headline. Labor determines whether the premium strategy can be delivered consistently. APFA President Julie Hedrick argued that American’s planned 70-seat premium configuration would expect fewer flight attendants to provide a more complex, personalized service, potentially increasing service times and disappointing customers.
Now, as American introduces 70 Business Suites and markets a premium international experience, they’re expecting a reduced number of Flight Attendants to deliver significantly more personalized service.
The causal issue is straightforward: premium hardware without adequate staffing and operating slack may raise capital intensity without producing a premium experience. Conversely, adding labor indiscriminately can erase the revenue benefit. Management must redesign service processes, staffing and schedules together.
No verified open-market insider purchase or sale is included in this analysis. The SEC Form 4 search endpoint did not return usable results during this research session, so it would be inappropriate to infer management conviction from insider transactions. The absence of a claim here is not evidence that no transactions occurred.
American is not a structurally irrelevant airline. It operates an extensive hub system, reported 1,594 total aircraft at Q1 2026 and produced nearly $56 billion of trailing revenue. Its Latin America franchise, domestic breadth, AAdvantage membership funnel and large fleet are substantial strategic assets.
But financial evidence places it behind Delta and United in the dimensions that currently matter most:
- Profit conversion: 3.0% TTM operating margin at American versus 7.7% at United and 8.1% at Delta.
- Balance-sheet resilience: negative stockholders’ equity and materially higher net debt than Delta.
- Cash conversion: $1.10 billion TTM free cash flow versus $2.54 billion at United and $6.07 billion at Delta.
- Valuation burden: American’s low equity value does not necessarily make it cheap because debt dominates enterprise value.
American should therefore be viewed as a scale leader but economic challenger. The network is the potential moat; inconsistent monetization and high leverage prevent shareholders from fully capturing it.
| Metric | American | United | Delta |
|---|---|---|---|
| TTM revenue | $55.99B | $62.90B | $68.29B |
| TTM operating income | $1.70B | $4.87B | $5.52B |
| TTM operating margin | 3.0% | 7.7% | 8.1% |
| TTM net income | $202M | $3.50B | $3.95B |
| TTM free cash flow | $1.10B | $2.54B | $6.07B |
| Market capitalization | $9.91B | $38.56B | $57.02B |
| Enterprise value | $43.90B | $62.06B | $72.33B |
A useful valuation warning follows from these figures. American’s market capitalization was only about one quarter of United’s, but its enterprise value was roughly 71% of United’s because of debt and other claims. Equity investors receive leveraged exposure to improvement: successful margin recovery can disproportionately benefit the stock, but modest operational setbacks can also consume a large share of residual equity value.
The turnaround should be judged by measurable economic milestones rather than isolated product announcements.
| Milestone | What success would look like | Why it matters | Near-term checkpoint |
|---|---|---|---|
| Unit economics | TRASM consistently exceeds CASM, with operating-margin expansion | Demonstrates that revenue gains survive incremental costs | Q2 2026 results on July 23 |
| Premium monetization | Sustained premium unit-revenue outperformance and disclosed mix growth | Validates cabin, lounge and wide-body investment | Management commentary and future segment disclosures |
| Loyalty | Recurring partner cash growth after excluding the Q1 one-time payment | Separates durable Citi economics from contract timing | Full-year 2026 partner cash and co-brand spend |
| Corporate recovery | Managed corporate revenue growth accompanied by yield and margin gains | Shows commercial-account rebuilding is economically productive | Quarterly managed-business indicators |
| Reliability | Improved completion factor, on-time performance and baggage handling | Necessary for premium pricing and customer retention | Peak-summer and winter operations |
| Balance sheet | Debt and net leverage continue falling while free cash flow remains positive | Reduces interest burden and equity risk | Year-end 2026 debt and 2027 maturities |
| Fleet execution | Deliveries, retrofits and engine availability remain on schedule | Avoids postponing efficiency and premium-seat benefits | 2026–2028 delivery cadence |
| Labor alignment | Operational improvement without service degradation or escalating conflict | Premium strategy depends on frontline execution | Union engagement and staffing outcomes |
Bull case — genuine turnaround: Premium and corporate revenue outgrow Main Cabin, reliability improves, Citi partner economics normalize above the prior run rate and free cash flow funds both debt reduction and fleet investment. American’s operating margin moves materially toward the high-single-digit level achieved by peers. Given the company’s small equity base relative to enterprise value, the equity response could be disproportionate.
Base case — partial repair: Revenue quality improves, but fuel, labor and aircraft costs absorb much of the gain. American becomes sustainably profitable and continues deleveraging, yet retains a multi-billion-dollar peer gap. This would justify a better risk profile without establishing peer-like economics.
Bear case — structural decline: New aircraft and premium facilities increase capital requirements while reliability remains weak. One-time loyalty cash obscures a slower recurring trajectory, supplier delays postpone efficiency gains and labor conflict degrades service. With high debt and negative book equity, the downside would fall heavily on shareholders.
American earned $111 million in 2025, versus $3.35 billion at United and $5.01 billion at Delta. It has reduced debt substantially, generated record Q1 2026 revenue and produced positive indicators in premium unit revenue, corporate sales, loyalty enrollment and co-brand spending. It is also committing capital to cabins, lounges, connectivity, network design and a large aircraft pipeline.
American’s primary weakness is not insufficient physical scale. It is weak profit conversion from that scale, caused by some combination of revenue quality, distribution execution, operational reliability, cost structure and financing burden. The premium-and-loyalty strategy addresses the right economic variables, but only if frontline operations and supplier delivery support it.
If American closes even half of its 2025 net-income gap with United while maintaining debt reduction, the improvement could be highly material to equity holders because the company’s market capitalization is small relative to both revenue and enterprise value. However, no disclosed timeline or verified bridge shows how each initiative adds up to $3 billion. Treating the entire gap as an attainable near-term earnings target would therefore be speculative.