Finviz7/5/2026Neutral (0.022)
SPCK - The SPAC and New Issue ETF Dividends
This article provides detailed financial data and performance metrics for SPCK, The SPAC and New Issue ETF.
Space Exploration Technologies Corp. designs, manufactures, and launches rockets and spacecraft, and provides satellite-based broadband services in the United States, Ireland, and ...
Loading analysis...
| Metric | Latest | YoYYoY means Year-over-Year. It compares the latest annual value with the previous annual value to show long-term trend strength. | QoQQoQ means Quarter-over-Quarter. It compares the latest quarter with the immediately previous quarter to show short-term momentum changes. |
|---|---|---|---|
| RevenueThe total money that came through the front door from selling things, before paying a single bill. Think of it as the grand total of every credit card swipe from customers. (YoY compares this year to last year's performance, while QoQ compares the current three months to the previous three). | — | — | — |
| Net IncomeThe absolute bottom line. If the company paid every single supplier, employee, banker, and tax collector, this is the actual money left in their pocket at the end of the day. | — | — | — |
| Gross MarginThe basic markup. If they sell a $100 pair of sneakers, this percentage tells you how much of that price tag is profit right after paying for the rubber and shoelaces, but before paying for things like store rent or TV commercials. | — | — | — |
| Operating MarginThe 'day job' efficiency score. Out of every dollar a customer spends, this shows how many cents the company keeps after making the product AND paying for all the everyday corporate overhead (like salaries, marketing, and keeping the lights on). | — | — | — |
| Net MarginThe final take-home percentage. When you strip away every conceivable cost, tax, and interest payment, this is the exact number of cents the company truly gets to keep from every dollar in sales. | — | — | — |
| Free Cash FlowThe holy grail of corporate cash. It's the spendable, physical money left over after the business pays for its daily operations AND buys the big, expensive upgrades (like new factories or servers) it needs to survive. This is the 'free' money they can use to pay dividends or buy back stock. | — | — | — |
| FCF MarginThe ultimate cash conversion rate. It shows how good the company is at turning regular sales directly into cold, hard, spendable cash. A high percentage means the business is an absolute cash-printing machine. | — | — | — |
| Debt / EquityThe financial risk gauge. It compares how much of the company's empire was built using borrowed money (loans) versus the owners' own money (shareholders). A high number means they are heavily leveraged and playing a riskier game; a low number means they are playing it safe. | — | — | — |
| Current RatioThe 12-month survival check. It simply compares the cash they have right now (plus things they can quickly turn into cash) against the immediate bills they absolutely must pay this year. A score above 1 means they have enough in the wallet to cover the upcoming bills without panicking. | — | — | — |
| Total AssetsThe absolute size of the company's empire. It bundles together absolutely everything of value they own—from the cash in the register and the inventory in the warehouse, to the software patents in the vault and the factories on the ground. | — | — | — |
| Metric | Annual (A vs E) | Annual Surprise | Quarter (A vs E) | Quarter Surprise |
|---|---|---|---|---|
| EPS Surprise | — | — | — | — |
| Revenue Surprise | — | — | — | — |
No major risk extracted yet.
No major tailwind extracted yet.
| Name | Title | Compensation | Gender | Year Born | Status |
|---|---|---|---|---|---|
Gwynne E. Shotwell | President, COO & Director | USD 1,110,222 | Female | 1965 | Active |
Bret W. Johnsen | CFO & Secretary | USD 825,000 | Male | 1969 | Active |
Elon R. Musk | Founder, Chairman, CEO, CTO, Chief Engineer & Chief Rocket Designer | USD 54,080 | Male | 1971 | Active |
Timothy Hughes | Senior Vice President of Global Business & Government Affairs | — | Male | — | Active |
Richard Lee | Treasurer | — | Male | — | Active |
Manjunath K. | Principal of infosec & policy and Head of Law Enforcement and Nodal Operations - Starlink India | — | Male | — | Active |
Michael Sagan | Senior Director of Legal | — | Male | — | Active |
This article provides detailed financial data and performance metrics for SPCK, The SPAC and New Issue ETF.
SpaceX is now held by approximately 200 ETFs, offering investors indirect access to the private company without direct private-market deals. These ETFs include $SPCX, which tracks SpaceX holdings and shows significant weightings and dollar values in its funds. This development was highlighted by Bloomberg's Senior ETF Analyst, Eric Balchunas.

The article provides a detailed revenue breakdown and financial overview for SPCU, the Defiance Daily Target 2X Long SPCX ETF. It lists various financial metrics including its last close price, percentage change, expense ratio, asset under management (AUM), and performance statistics. The ETF, categorized as Equity - Leveraged / Inverse, holds 9 total assets with an AUM of $57.59 million.

This article provides key financial data for SPCU, the Defiance Daily Target 2X Long SPCX ETF. It details the last closing price, daily percentage change, and an overview of its financial characteristics as an exchange-traded fund. The data also includes performance metrics, asset under management, and volatility information.
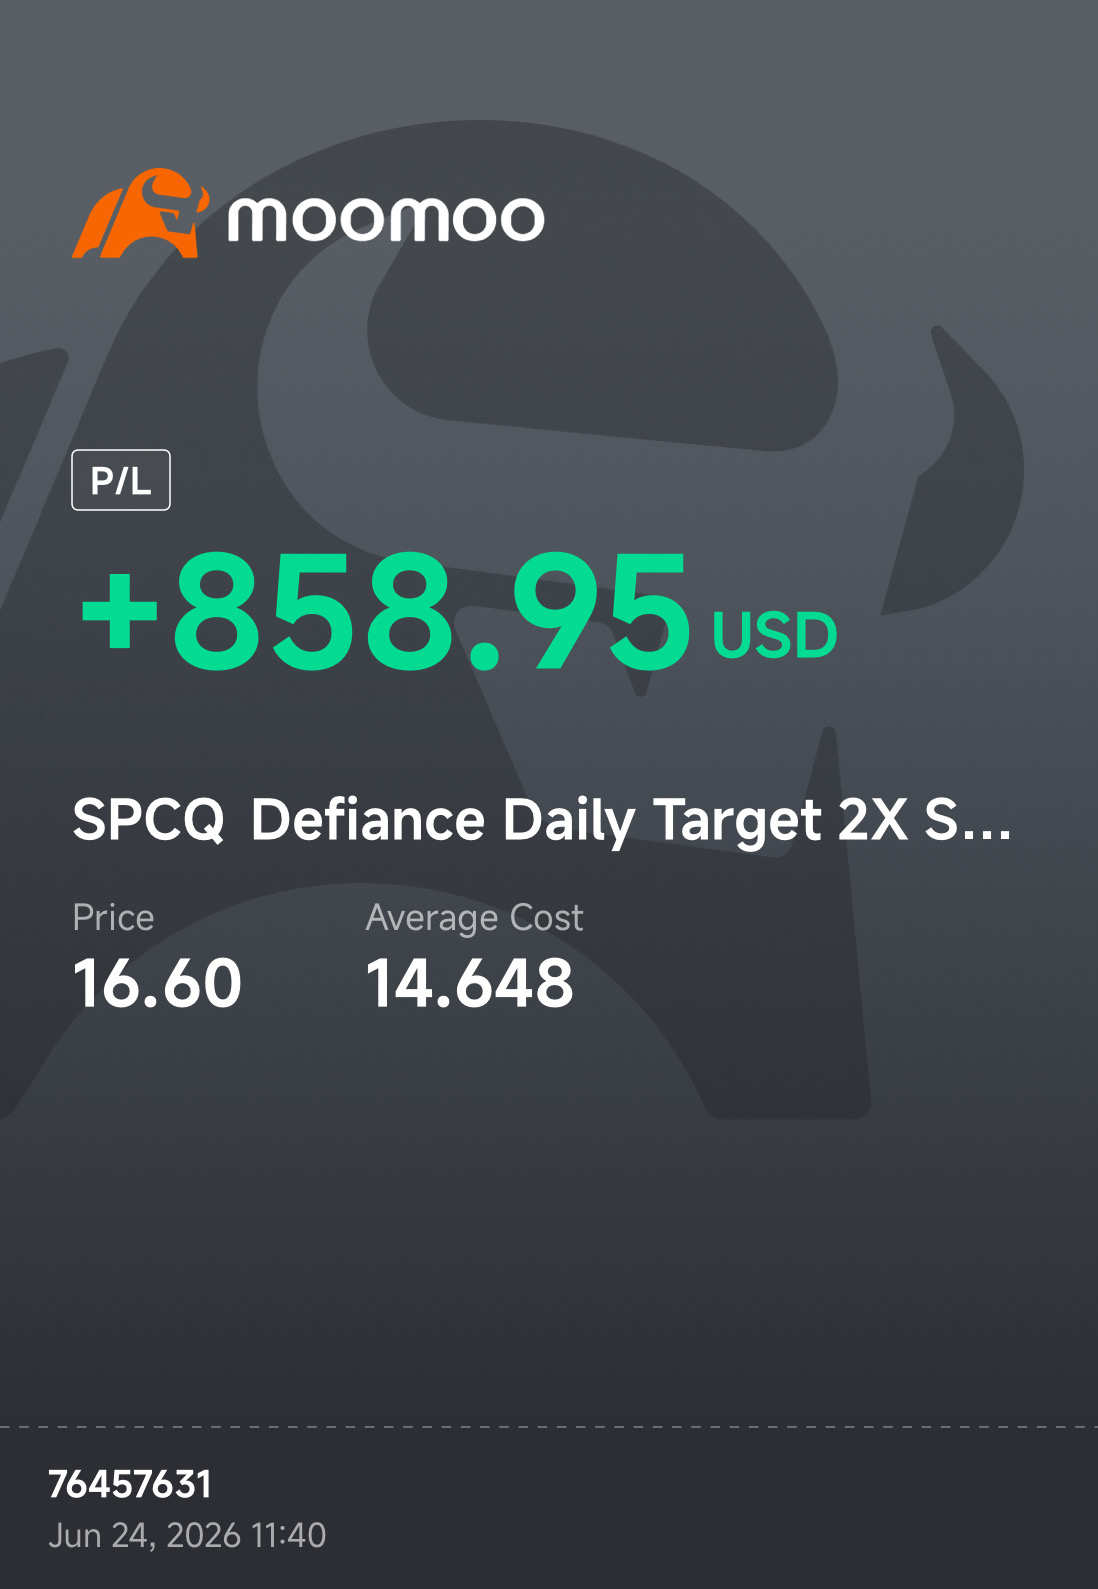
The article is a single-line post from a user named "76457631" on the moomoo Community forum, labeling the "$Defiance Daily Target 2X Short SPCX ETF (SPCQ.US)$" as a "scam stock ez money." It is part of a discussion with 26.9M views and 128K posts. The post includes disclaimers about the community being for educational purposes only.