
%22%2F%3E%0A%20%20%3Ccircle%20cx%3D%22220%22%20cy%3D%22150%22%20r%3D%22180%22%20fill%3D%22%2322d3ee%22%20fill-opacity%3D%220.12%22%2F%3E%0A%20%20%3Ccircle%20cx%3D%221010%22%20cy%3D%22130%22%20r%3D%22220%22%20fill%3D%22%2338bdf8%22%20fill-opacity%3D%220.08%22%2F%3E%0A%20%20%3Ccircle%20cx%3D%22920%22%20cy%3D%22520%22%20r%3D%22170%22%20fill%3D%22%2322d3ee%22%20fill-opacity%3D%220.06%22%2F%3E%0A%20%20%3Cpath%20d%3D%22M140%20430h920%22%20stroke%3D%22url(%23line)%22%20stroke-width%3D%2212%22%20stroke-linecap%3D%22round%22%2F%3E%0A%20%20%3Cpath%20d%3D%22M220%20360c120-150%20260-220%20380-220s260%2070%20380%20220%22%20fill%3D%22none%22%20stroke%3D%22%2367e8f9%22%20stroke-opacity%3D%220.5%22%20stroke-width%3D%2216%22%20stroke-linecap%3D%22round%22%20stroke-linejoin%3D%22round%22%2F%3E%0A%20%20%3Cpath%20d%3D%22M300%20398h600%22%20stroke%3D%22%2394a3b8%22%20stroke-opacity%3D%220.24%22%20stroke-width%3D%228%22%20stroke-linecap%3D%22round%22%2F%3E%0A%20%20%3Ctext%20x%3D%22220%22%20y%3D%22510%22%20fill%3D%22%23e2e8f0%22%20fill-opacity%3D%220.7%22%20font-family%3D%22Arial%2C%20Helvetica%2C%20sans-serif%22%20font-size%3D%2238%22%20letter-spacing%3D%228%22%3EINSIGHTS%3C%2Ftext%3E%0A%3C%2Fsvg%3E)
Bottom line
UAL beat Q2 EPS and revenue, but the $6B fuel-cost guide means airline equities are now trading oil pass-through, not capacity or premium revenue.
United Airlines Holdings reported Q2 2026 adjusted EPS of $1.99 vs $1.88 consensus on revenue of $17.67B vs $17.61B consensus, both small beats, according to CNBC's Leslie Josephs reporting. Unit revenue rose 12.1% YoY - the highest since early 2023 per FactSet - and the carrier expanded capacity 3.5% in the quarter. Net income fell more than 17% to $805 million ($2.46/share), or $649 million on an adjusted basis. The headline beat is real, but the equity tape priced the fuel guide, not the beat: UAL traded down 2.37% after-hours to $120.97 on volume of 1,033,400 shares.
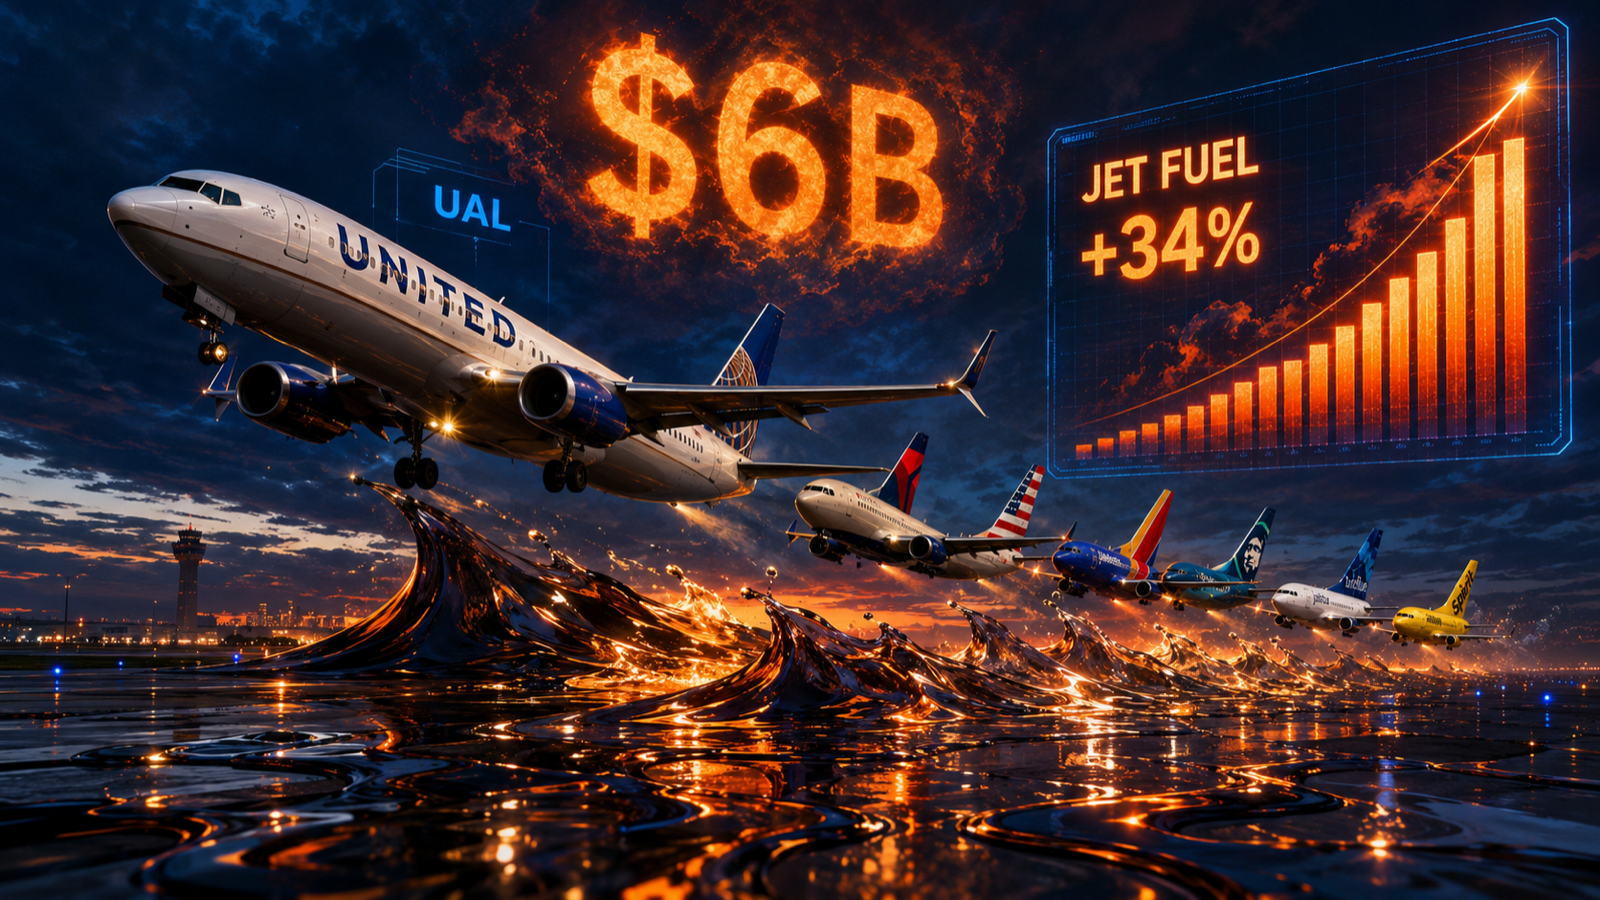
The fuel-cost guide is the binding data point. UAL said higher fuel prices could add nearly $6 billion to its expenses this year compared with what it expected at the start of 2026, with Q2 fuel costs up 84% YoY to $2.3 billion. Per Argus data published by Airlines for America, jet fuel prices at major U.S. airports are up 34% in July alone through Tuesday amid the U.S.-Iran conflict. UAL guided Q3 EPS to $2.50-$3.50 vs $3.60 consensus and said it would cover up to 90% of higher costs in Q3 and all of them in Q4 - implying some Q3 margin compression even at the top end of the guide.
For Delta Air Lines, American Airlines, Southwest Airlines, Alaska Air, JetBlue Airways, and Spirit Airlines, the UAL print is the first binding read on the industry's ability to pass through fuel costs in a still-strong demand environment. Delta has already said it is passing on more of the higher costs to flyers. The trade is no longer about premium revenue or international expansion - it is about how much of the $6B fuel hit each airline can pass through, and which carrier survives the worst-case fuel tape if the U.S.-Iran conflict extends through Q4.
The trade that broke
The 'airlines are the cleanest cyclical trade' thesis is being split into 'airlines with fuel hedges' and 'airlines without fuel hedges' - the latter is now a different trade.
For most of 2024 and 2025, the airline playbook was that the cohort was the cleanest cyclical trade: capacity discipline, premium revenue growth, and a strong demand backdrop supported earnings and multiples simultaneously. UAL, Delta Air Lines, American Airlines, and Southwest Airlines all benefited from that framing. The July 15 print broke that thesis into two pieces - airlines with credible fuel hedges and airlines without them - and the tape is repricing both sides.
The first piece is 'airlines with fuel hedges.' UAL said it would cover up to 90% of higher costs in Q3 and all of them in Q4, which implies an active hedging program that is materially offsetting the spot-market move. Delta Air Lines has historically run a similar hedging program and has already said it is passing on more of the higher costs to flyers - a signal that the hedging program is being used as a bridge while fares are pushed higher. American Airlines and Southwest Airlines have smaller hedging programs and are more exposed to spot-market moves. The trade used to be 'airlines benefit from strong demand'; it is now 'airlines with hedges have a 2-quarter bridge; airlines without hedges are exposed to the spot tape.'
The second piece is 'airlines without fuel hedges.' JetBlue Airways and Spirit Airlines have minimal hedging and are the most exposed to a sustained jet-fuel spike. Spirit's collapse earlier in the cycle - high fuel prices + weak pricing power = the worst combination - is the template for what a sustained fuel tape can do to a sub-scale carrier. Alaska Air is somewhere in the middle, with a moderate hedging program but a regional network that is more exposed to fuel moves than a national carrier. The trade split is: long UAL/DAL with hedges, neutral AAL/LUV with partial hedges, short JBLU/SAVE without hedges.
| Name | Ticker | Fuel exposure | UAL print read-through |
|---|---|---|---|
| United Airlines | UAL | Hedged; covers 90% Q3 / 100% Q4 | Reference: Q2 beat on EPS/rev; $6B added fuel cost; Q3 guide below consensus |
| Delta Air Lines | DAL | Hedged; passing costs to flyers | Direct read: confirmed fare increases; demand has remained strong |
| American Airlines | AAL | Partial hedge; some exposure | Indirect: AAL will follow UAL guide; some Q3 margin compression |
| Southwest Airlines | LUV | Partial hedge; some exposure | Indirect: LUV faces same fuel-cost pressure; lower pass-through capacity |
| Alaska Air | ALK | Moderate hedge; regional | Indirect: regional-network fuel exposure; moderate hedge offset |
| JetBlue Airways | JBLU | Minimal hedge; full spot exposure | Negative: spot-market exposure + premium-market competition |
| Spirit Airlines | SAVE | Minimal hedge; full spot exposure | Negative: Spirit's collapse template; weakest balance sheet |
What the numbers say
12.1% unit revenue growth is the strongest signal that demand is intact; the $6B fuel guide is the strongest signal that the supply side is broken.
UAL's Q2 print tells a two-sided story. On the demand side, unit revenue rose 12.1% YoY - the highest since early 2023 per FactSet - and the carrier expanded capacity 3.5%. Total revenue rose 16% YoY to $17.67B, with strength in premium, corporate, and no-frills basic economy tickets, and rising unit revenue for both domestic and international trips. Net income fell more than 17% to $805M on higher fuel costs, but the adjusted EPS of $1.99 still beat the $1.88 consensus. The demand side is intact.
On the cost side, the picture is more challenging. Q2 fuel costs rose 84% YoY to $2.3 billion, and the FY guide assumes an additional $6 billion in fuel costs vs the start of the year. July jet fuel prices at major U.S. airports are up 34% MTD through Tuesday per Argus data published by Airlines for America, driven by the U.S.-Iran conflict and the broader energy tape. UAL guided Q3 EPS to $2.50-$3.50 vs $3.60 consensus, implying roughly 14-31% YoY EPS compression at the midpoint even before the August-September fuel tape plays out.
UAL executives will hold an earnings call Thursday at 10:30 a.m. ET. The market will be listening for three things: (1) confirmation of the hedging program and any changes to the coverage ratio; (2) commentary on fare pass-through and the demand elasticity at higher fare levels; (3) capacity guidance for Q4, given UAL's signal that it could 'further cut its capacity plans because of higher fuel costs this year.' The Q4 capacity decision is the binding read on whether the carrier is willing to take a supply-side hit to defend unit revenue, or whether it prioritizes volume over margin.
United Airlines Q2 2026: beat on top, fuel on bottom
Reference points from CNBC reporting on the July 15, 2026 UAL print. The chart documents the EPS/revenue beat, the fuel-cost guide, and the Q3 EPS guide vs consensus.
단위: USD / percent
Q2 adj EPS actual ($)
Beat $1.88 consensus by ~6%
2
Q3 adj EPS guide midpoint ($)
Range $2.50-$3.50; below $3.60 consensus
3
FY adj EPS guide midpoint ($)
Range $9-$11; higher end of April $7-$11 guide
10
Q2 revenue ($B)
+16% YoY; vs $17.61B consensus
17.7
Q2 fuel cost ($B)
+84% YoY; Q2 fuel cost line
2.3
FY added fuel cost ($B)
vs start-of-2026 expectations; guide assumes current July prices
6
July jet fuel MTD change (%)
Argus/A4A data through Tuesday
34
Why it matters
The airline trade is now an oil-pass-through trade, not a cyclical-demand trade - and the worst-case tape is the binding constraint.
The macro question underneath the UAL print is whether the U.S.-Iran conflict extends through Q4, which would mean sustained jet-fuel prices near current levels. At the start of 2026, UAL's plan assumed jet-fuel prices near $80/barrel. The current tape has jet fuel up 34% in July alone, which puts the run-rate near $107/barrel. A sustained Q3-Q4 at that level would push UAL's full-year fuel bill above the $6B guide and would force the carrier to choose between capacity cuts and fare hikes - both of which have earnings consequences.
For Delta Air Lines, American Airlines, and Southwest Airlines, the UAL print is the first binding read on the industry's ability to pass through fuel costs in a still-strong demand environment. Delta has confirmed it is passing on more of the higher costs to flyers, which is the right strategy if demand elasticity at higher fare levels remains low. The bigger question is what happens if jet fuel prices spike another 20-30% on a Hormuz escalation - that would push the run-rate toward $130/barrel, which is the level at which even hedged carriers start to take meaningful margin hits.
For the broader market, the read-through is that airlines are no longer trading as a cyclical-demand cohort - they are trading as an oil-pass-through cohort. ExxonMobil, Chevron, Valero, Marathon Petroleum, and Phillips 66 are the natural long pair against a short airline basket. The other natural long is the jet-fuel hedging complex - airlines that have locked in coverage through Q4 are the cleanest expression of the 'demand is intact but fuel is broken' thesis. UAL, with its 90% Q3 / 100% Q4 coverage ratio, is the cleanest single name in that framework.
- UAL beat Q2 EPS ($1.99 vs $1.88) and revenue ($17.67B vs $17.61B), but traded down 2.37% on the $6B fuel-cost guide.
- Q2 fuel costs rose 84% YoY to $2.3B; July jet fuel prices up 34% MTD through Tuesday per Argus/A4A data.
- Q3 EPS guide of $2.50-$3.50 is below the $3.60 consensus; FY guide of $9-$11 is the higher end of the prior $7-$11 range.
- Unit revenue +12.1% YoY is the strongest since early 2023 - demand is intact, but the supply side is broken.
- Read-through: long UAL/DAL with hedges; neutral AAL/LUV with partial hedges; short JBLU/SAVE without hedges.
What to watch
Watch UAL's earnings call for hedging details, Delta and American's next moves, the Hormuz tape, and jet-fuel crack spreads.
The first tell is UAL's earnings call Thursday at 10:30 a.m. ET. The market will be listening for confirmation of the hedging program (90% Q3 / 100% Q4 coverage), any changes to the coverage ratio, and any commentary on fare pass-through. A confirmation of the hedge ratios is a re-rating catalyst; a walk-back is a margin-warning signal.
The second tell is Delta Air Lines and American Airlines's next moves. Delta has confirmed fare increases; AAL has not yet commented. If AAL follows Delta with a fare hike, the industry is in pass-through mode and the airline cohort can hold the tape. If AAL holds fares to defend market share, the UAL hedge ratio becomes the only thing standing between the cohort and a margin reset.
The third tell is the Hormuz tape. The U.S. conducted several rounds of strikes on Iran on Wednesday, and President Trump said the pressure was working, telling reporters that Iran now wants to meet. Kalshi traders now see a 90% probability that gas prices will cross $4 per gallon by end of July (up from 56% two days ago). A Hormuz escalation would push jet fuel to $130/barrel or higher; a diplomatic resolution would pull jet fuel back toward the start-of-year baseline. The fourth tell is jet-fuel crack spreads - the refining margin between crude oil and jet fuel. A widening crack spread is a sign that jet-fuel supply is tight even when crude is stable, which would compound the UAL fuel-cost pressure.