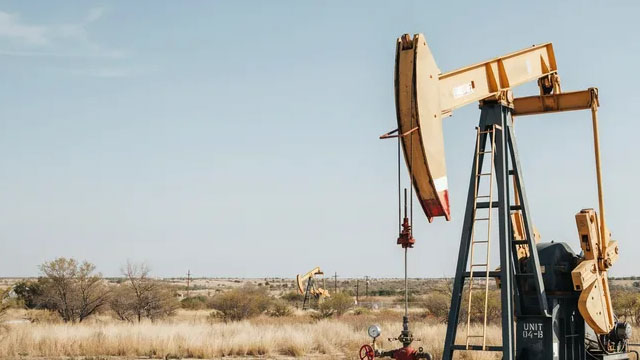
Helmerich & Payne, Inc., junto con sus compañías afiliadas, ofrece servicios de perforación especializados y soluciones innovadoras para empresas involucradas en la ...
Helmerich & Payne, Inc. (H&P) is a leading drilling contractor in the energy sector, specializing in performance-driven drilling solutions and advanced technologies to enhance hydrocarbon recovery. As of September 30, 2021, the company operates a substantial fleet of 236 land rigs in North America, 30 international land rigs, and 7 ...Helmerich & Payne, Inc. (H&P) is a leading drilling contractor in the energy sector, specializing in performance-driven drilling solutions and advanced technologies to enhance hydrocarbon recovery. As of September 30, 2021, the company operates a substantial fleet of 236 land rigs in North America, 30 international land rigs, and 7 offshore platform rigs. Its North America Solutions division conducts drilling across multiple U.S. states including Colorado, Texas, and North Dakota, and focuses on developing technologies for drilling efficiency and wellbore quality. The Offshore Gulf of Mexico division operates in Louisiana and federal waters, while International Solutions manages projects in Argentina, Bahrain, Colombia, and the United Arab Emirates. Beyond core drilling, H&P maintains commercial real estate interests in Tulsa, Oklahoma, including a shopping center with approximately 390,000 square feet of leasable space and 176 acres of undeveloped land. Financially, H&P reported a market cap of $3.71 billion as of the latest data, with a price-to-sales ratio of 0.93 and an enterprise value-to-EBITDA of 3.03, reflecting its operating scale. The company employs around 6,200 full-time staff and is led by President and CEO Trey Adams III. H&P emphasizes safety, efficiency, and innovation, aiming to deliver reliable drilling productivity to its clients. With over a century of history, H&P continues to adapt to market changes and technological advancements, positioning itself as a trusted partner in the oil drilling industry.
Plutux no es un asesor de inversiones. Los datos de mercado y el análisis generado por IA son solo informativos y educativos, no asesoramiento de inversión. Aviso legal
InteranualYoY significa Year-over-Year (interanual). Compara el último valor anual con el valor anual anterior para mostrar la fortaleza de la tendencia a largo plazo.
TrimestralQoQ significa Quarter-over-Quarter (intertrimestral). Compara el último trimestre con el trimestre inmediatamente anterior para mostrar cambios de impulso a corto plazo.
IngresosEl dinero total que entró por la puerta principal al vender cosas, antes de pagar una sola factura. Piensa en esto como el gran total de cada compra con tarjeta de los clientes. (YoY compara el rendimiento de este año con el del año pasado, mientras que QoQ compara los tres meses actuales con los tres anteriores).
$3.7B
+35.9%
+11.0%
Beneficio netoEl resultado final absoluto. Si la empresa pagara a cada proveedor, empleado, banquero y recaudador de impuestos, este es el dinero real que queda en su bolsillo al final del día.
$-165.1M
-148.0%
+229.1%
Margen brutoEl margen básico. Si venden unas zapatillas de 100 dólares, este porcentaje indica cuánto de ese precio es ganancia justo después de pagar el caucho y los cordones, pero antes de pagar el alquiler de la tienda o los anuncios de televisión.
+14.8%
-44.1%
+70.9%
Margen operativoLa puntuación de eficiencia del 'trabajo diario'. De cada dólar que gasta un cliente, esto muestra cuántos centavos mantiene la empresa después de fabricar el producto Y pagar todos los gastos generales corporativos (como salarios, marketing y mantener las luces encendidas).
+6.2%
-62.2%
+1462.3%
Margen netoEl porcentaje final que se lleva a casa. Cuando se eliminan todos los costos concebibles, impuestos y pagos de intereses, este es el número exacto de centavos que la empresa realmente se queda de cada dólar en ventas.
-4.4%
-135.3%
+216.3%
Flujo de caja libreEl santo grial del efectivo corporativo. Es el dinero físico gastable que queda después de que el negocio paga sus operaciones diarias Y compra las actualizaciones grandes y costosas (como nuevas fábricas o servidores) que necesita para sobrevivir. Este es el dinero 'libre' que pueden usar para pagar dividendos o recomprar acciones.
$116.6M
-38.5%
+419.2%
Margen FCFLa tasa definitiva de conversión de efectivo. Muestra qué tan buena es la empresa para convertir ventas regulares directamente en efectivo frío, duro y gastable. Un porcentaje alto significa que el negocio es una auténtica máquina de imprimir dinero.
+3.1%
-54.8%
+387.6%
Deuda/PatrimonioEl indicador de riesgo financiero. Compara cuánto del imperio de la empresa se construyó con dinero prestado (préstamos) frente al dinero propio de los propietarios (accionistas). Un número alto significa que están muy apalancados y juegan un juego más arriesgado; un número bajo significa que juegan a lo seguro.
85.1%
+33.6%
-8.6%
Ratio corrienteLa verificación de supervivencia de 12 meses. Simplemente compara el efectivo que tienen ahora mismo (más cosas que pueden convertirse rápidamente en efectivo) con las facturas inmediatas que absolutamente deben pagar este año. Una puntuación superior a 1 significa que tienen suficiente en la billetera para cubrir las próximas facturas sin entrar en pánico.
1.80x
-32.6%
+15.0%
Activos totalesEl tamaño absoluto del imperio de la empresa. Agrupa absolutamente todo lo valioso que poseen, desde el efectivo en la caja registradora y el inventario en el almacén, hasta las patentes de software en la bóveda y las fábricas en el suelo.
Operator: Please stand by. Your program is about to begin. Good day, everyone. And welcome to the H and P Fiscal Third Quarter Earnings Call. At this time, all participants are in a listen-only mode. Later, you will have the opportunity to ask questions during the question and answer session. You may register to ask a question at any time by pressing star and 1 on your telephone keypad. You may withdraw your question Please note this call is being recorded. Operators will be standing by if you should need any assistance. It is now my pleasure to turn the conference over to Kris Nicol, Vice President of Investor Relations.
Kris Nicol: Welcome everyone to Helmerich and Payne's conference call and webcast for the Third Fiscal Quarter of 26. On today's call, Trey Adams, our President and CEO, will be joined by Todd Scruggs, our Chief Financial Officer and Mike Lennox, Executive Vice President of the Western Hemisphere. Before we begin our prepared remarks, I would like to remind everyone that this call will include forward-looking statements as defined under securities laws. Although management believes that the expectations reflected in such forward looking statements are reasonable, can give no assurance that the expectations will prove to be correct. Please refer to our filings with the SEC for a list of factors that may cause actual results to differ materially from those in the forward looking statements made during this call. Adjusted EBITDA, direct margin, adjusted EPS and free cash flow are non GAAP measures. The most directly comparable GAAP measures and reconciliations are included in our earnings release and investor materials on our investor relations website. Also want to highlight that we have a presentation which supports the prepared remarks from the management team and can be found on the IR website. With that, I will turn the call over to Trey.
Raymond John Adams: Thank you, Kris. Hello, everyone. Thank you for joining us. As always, we appreciate your interest in H and P. I will begin with an overview of our quarter results, I will then turn to discuss the broader macro environment, current rig market dynamics, and several key commercial developments. Including a specific update on our activities in the Vaca Muerta in Argentina. Todd will then walk through our financial results, share details on our financial framework, and discuss additional cost optimization actions we are initiating. He will then provide guidance for the fourth fiscal quarter and full year. To wrap up, I will then return to summarize the key takeaways before opening the line for questions. Turning to slide 4 of the presentation. I would like to begin by walking through some of our key highlights from the fiscal third quarter. We delivered strong financial and operational performance during the quarter, led by our operations in the U.S. Adjusted EBITDA was $236 million coming in comfortably ahead of the implied midpoint of our guidance. We also generated strong …