HighPeak Energy, Inc. operates as an independent energy company, primarily focused on the acquisition, exploration, development, and extraction of crude oil, natural ...
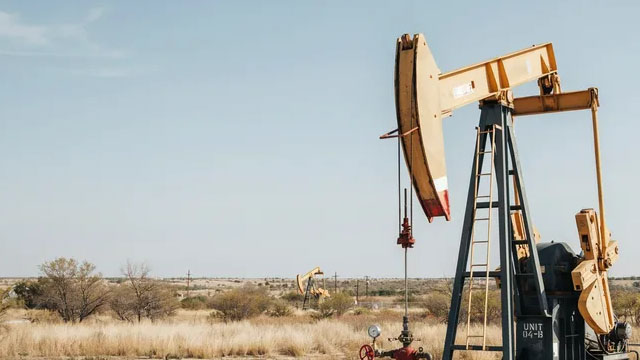
HighPeak Energy, Inc. is a publicly traded independent energy company focused on unconventional oil and natural gas development in the Midland Basin of West Texas. Its core activities include acquiring mineral and leasehold interests, drilling and completing horizontal wells, developing infrastructure, and producing crude oil, natural gas, and natural gas ...HighPeak Energy, Inc. is a publicly traded independent energy company focused on unconventional oil and natural gas development in the Midland Basin of West Texas. Its core activities include acquiring mineral and leasehold interests, drilling and completing horizontal wells, developing infrastructure, and producing crude oil, natural gas, and natural gas liquids. The company’s acreage position is concentrated primarily in Howard County and is described as a contiguous position of more than 140,000 net acres, with more than 90% operated. This concentration can support development efficiencies, consistent drilling practices, and greater control over capital allocation and production timing.
The company was established in 2019 and subsequently became publicly traded through a business combination involving Pure Acquisition Corporation. Its corporate headquarters are located at 421 West 3rd Street in Fort Worth, Texas. Michael L. Hollis, commonly referred to as Mike Hollis, serves as President and Chief Executive Officer and is also involved in the company’s board leadership. HighPeak operates with a relatively small corporate workforce; the supplied data reports 47 full-time employees, placing it in the 0-100 employee category. As an exploration and production company, it also relies extensively on contractors, oilfield-service providers, midstream operators, drilling companies, completion specialists, and other third parties.
HighPeak’s economic model depends primarily on the volume and mix of hydrocarbons produced, realized commodity prices, well productivity, drilling and completion costs, lease operating expenses, transportation charges, gathering arrangements, and royalty burdens. Oil sales are generally central to the company’s revenue profile, while natural gas and natural gas liquids provide additional revenue streams. The business is capital intensive because a substantial portion of operating cash flow may be reinvested in drilling, completions, land, facilities, gathering systems, and infrastructure. The supplied trailing-twelve-month data shows capital expenditures of approximately 104% of operating cash flow, highlighting the importance of disciplined development spending and access to liquidity.
The supplied financial indicators show an enterprise value of approximately $1.91 billion and a market capitalization of approximately $910 million at the referenced snapshot. The company reported trailing revenue per share of approximately $6.16, operating cash flow per share of approximately $3.26, and negative free cash flow per share of approximately $0.14. Its trailing net margin was negative, while its EBITDA margin was approximately 51%, reflecting the difference between operating cash generation and bottom-line results after depreciation, financing costs, and other expenses. HighPeak also reported a current ratio below 1.0 and debt-to-equity of approximately 0.75, indicating that liquidity and leverage remain important considerations.
HighPeak’s principal opportunities include continued drilling inventory development, improved well performance, operational scale, oil-price strength, and efficient use of its contiguous acreage. Key risks include commodity-price volatility, inflation in drilling and completion services, regulatory changes, environmental obligations, weather, transportation constraints, interest costs, reserve uncertainty, and the continuing need to fund capital expenditures. The company’s stated strategic direction is centered on developing its Midland Basin assets and converting its acreage and drilling inventory into sustainable production and cash flow.
Plutux no es un asesor de inversiones. Los datos de mercado y el análisis generado por IA son solo informativos y educativos, no asesoramiento de inversión. Aviso legal
InteranualYoY significa Year-over-Year (interanual). Compara el último valor anual con el valor anual anterior para mostrar la fortaleza de la tendencia a largo plazo.
TrimestralQoQ significa Quarter-over-Quarter (intertrimestral). Compara el último trimestre con el trimestre inmediatamente anterior para mostrar cambios de impulso a corto plazo.
IngresosEl dinero total que entró por la puerta principal al vender cosas, antes de pagar una sola factura. Piensa en esto como el gran total de cada compra con tarjeta de los clientes. (YoY compara el rendimiento de este año con el del año pasado, mientras que QoQ compara los tres meses actuales con los tres anteriores).
$863.4M
-19.3%
+26.2%
Beneficio netoEl resultado final absoluto. Si la empresa pagara a cada proveedor, empleado, banquero y recaudador de impuestos, este es el dinero real que queda en su bolsillo al final del día.
$19.0M
-80.1%
+164.6%
Margen brutoEl margen básico. Si venden unas zapatillas de 100 dólares, este porcentaje indica cuánto de ese precio es ganancia justo después de pagar el caucho y los cordones, pero antes de pagar el alquiler de la tienda o los anuncios de televisión.
+20.7%
-41.2%
+288.6%
Margen operativoLa puntuación de eficiencia del 'trabajo diario'. De cada dólar que gasta un cliente, esto muestra cuántos centavos mantiene la empresa después de fabricar el producto Y pagar todos los gastos generales corporativos (como salarios, marketing y mantener las luces encendidas).
+17.4%
-44.9%
+76.6%
Margen netoEl porcentaje final que se lleva a casa. Cuando se eliminan todos los costos concebibles, impuestos y pagos de intereses, este es el número exacto de centavos que la empresa realmente se queda de cada dólar en ventas.
+2.2%
-75.3%
+151.2%
Flujo de caja libreEl santo grial del efectivo corporativo. Es el dinero físico gastable que queda después de que el negocio paga sus operaciones diarias Y compra las actualizaciones grandes y costosas (como nuevas fábricas o servidores) que necesita para sobrevivir. Este es el dinero 'libre' que pueden usar para pagar dividendos o recomprar acciones.
$-10.6M
-115.3%
+126.6%
Margen FCFLa tasa definitiva de conversión de efectivo. Muestra qué tan buena es la empresa para convertir ventas regulares directamente en efectivo frío, duro y gastable. Un porcentaje alto significa que el negocio es una auténtica máquina de imprimir dinero.
-1.2%
-118.9%
+121.1%
Deuda/PatrimonioEl indicador de riesgo financiero. Compara cuánto del imperio de la empresa se construyó con dinero prestado (préstamos) frente al dinero propio de los propietarios (accionistas). Un número alto significa que están muy apalancados y juegan un juego más arriesgado; un número bajo significa que juegan a lo seguro.
71.1%
+22.5%
+2.5%
Ratio corrienteLa verificación de supervivencia de 12 meses. Simplemente compara el efectivo que tienen ahora mismo (más cosas que pueden convertirse rápidamente en efectivo) con las facturas inmediatas que absolutamente deben pagar este año. Una puntuación superior a 1 significa que tienen suficiente en la billetera para cubrir las próximas facturas sin entrar en pánico.
1.13x
+64.7%
+29.3%
Activos totalesEl tamaño absoluto del imperio de la empresa. Agrupa absolutamente todo lo valioso que poseen, desde el efectivo en la caja registradora y el inventario en el almacén, hasta las patentes de software en la bóveda y las fábricas en el suelo.
Operator: Good day, and welcome to High Peak Energy. 26 Second Quarter Earnings Conference Call. At this time, all participants are in a listen-only mode. After the speakers' presentation, there will be a question-and-answer session. To ask a question during the session, you need to press *11 on your telephone. You will then hear an automated message advising your hand is raised. To answer your question, please press *1 again. Also, the call is being recorded. I would now like to turn the call over to Steven W. Tholen, CFO. Please go ahead.
Steven W. Tholen: Good morning, everyone, and welcome to HighPeak Energy's Second Quarter 2026 Earnings Call. Representing HighPeak today are President and CEO, Michael L. Hollis; Executive Vice President, Daniel Meads Silver Senior Vice President, Christopher Mundy; and I am Steven W. Tholen, the chief financial officer. During today's call, we may refer to our August presentation and press release which can be found on High Peak's website. Today's call participants may make certain forward-forward-looking statements relating to the company's financial condition, results of operations, expectations, plans, goals, assumptions, and future performance, so please refer to the cautionary information regarding forward-forward-looking statements and related risks in the company's SEC filings. Including the fact that actual results may differ materially from our expectations due to a variety of reasons. Many of which are beyond our control. We will also refer to certain non-GAAP financial measures on today's call so please see the reconciliations in the earnings release and in our Invest August investor presentation. I will now turn the call over to our President and CEO, Mike Hollis.
Michael L. Hollis: Thank you, Steven. Good morning, everyone, and thank you for joining us today to discuss our second quarter 2026 results. It was another strong quarter for HighPeak. Our team continued to do what they have consistently done. Execute the development plan operate efficiently, spend capital responsibly, and focus on creating long-term value for our shareholders. Production during the quarter was essentially flat with the first quarter and once again came in above the high end of our guidance range. That performance reflects the quality of our assets and more importantly, the ability of our operations team to consistently deliver results. From a capital spending perspective, the second quarter was expected to be our highest spending quarter of the year when we built our 2026 plan. During the quarter, we also chose to pull forward some completion activity that was originally scheduled later in the year. We saw an opportunity to lock in attractive frac pricing and continue working with a simul-frac crew that has been generating meaningful efficiency gains faster cycle times, and lower cost. When we see opportunities to improve returns and create additional value, we are going to take advantage. of Advancing that work …