
%22%2F%3E%0A%20%20%3Ccircle%20cx%3D%22220%22%20cy%3D%22150%22%20r%3D%22180%22%20fill%3D%22%2322d3ee%22%20fill-opacity%3D%220.12%22%2F%3E%0A%20%20%3Ccircle%20cx%3D%221010%22%20cy%3D%22130%22%20r%3D%22220%22%20fill%3D%22%2338bdf8%22%20fill-opacity%3D%220.08%22%2F%3E%0A%20%20%3Ccircle%20cx%3D%22920%22%20cy%3D%22520%22%20r%3D%22170%22%20fill%3D%22%2322d3ee%22%20fill-opacity%3D%220.06%22%2F%3E%0A%20%20%3Cpath%20d%3D%22M140%20430h920%22%20stroke%3D%22url(%23line)%22%20stroke-width%3D%2212%22%20stroke-linecap%3D%22round%22%2F%3E%0A%20%20%3Cpath%20d%3D%22M220%20360c120-150%20260-220%20380-220s260%2070%20380%20220%22%20fill%3D%22none%22%20stroke%3D%22%2367e8f9%22%20stroke-opacity%3D%220.5%22%20stroke-width%3D%2216%22%20stroke-linecap%3D%22round%22%20stroke-linejoin%3D%22round%22%2F%3E%0A%20%20%3Cpath%20d%3D%22M300%20398h600%22%20stroke%3D%22%2394a3b8%22%20stroke-opacity%3D%220.24%22%20stroke-width%3D%228%22%20stroke-linecap%3D%22round%22%2F%3E%0A%20%20%3Ctext%20x%3D%22220%22%20y%3D%22510%22%20fill%3D%22%23e2e8f0%22%20fill-opacity%3D%220.7%22%20font-family%3D%22Arial%2C%20Helvetica%2C%20sans-serif%22%20font-size%3D%2238%22%20letter-spacing%3D%228%22%3EINSIGHTS%3C%2Ftext%3E%0A%3C%2Fsvg%3E)
What happened (and what was actually filed)
Jersey Mike’s set IPO terms that value the business at up to $7.94B—at a price investors can underwrite with franchise cash flows
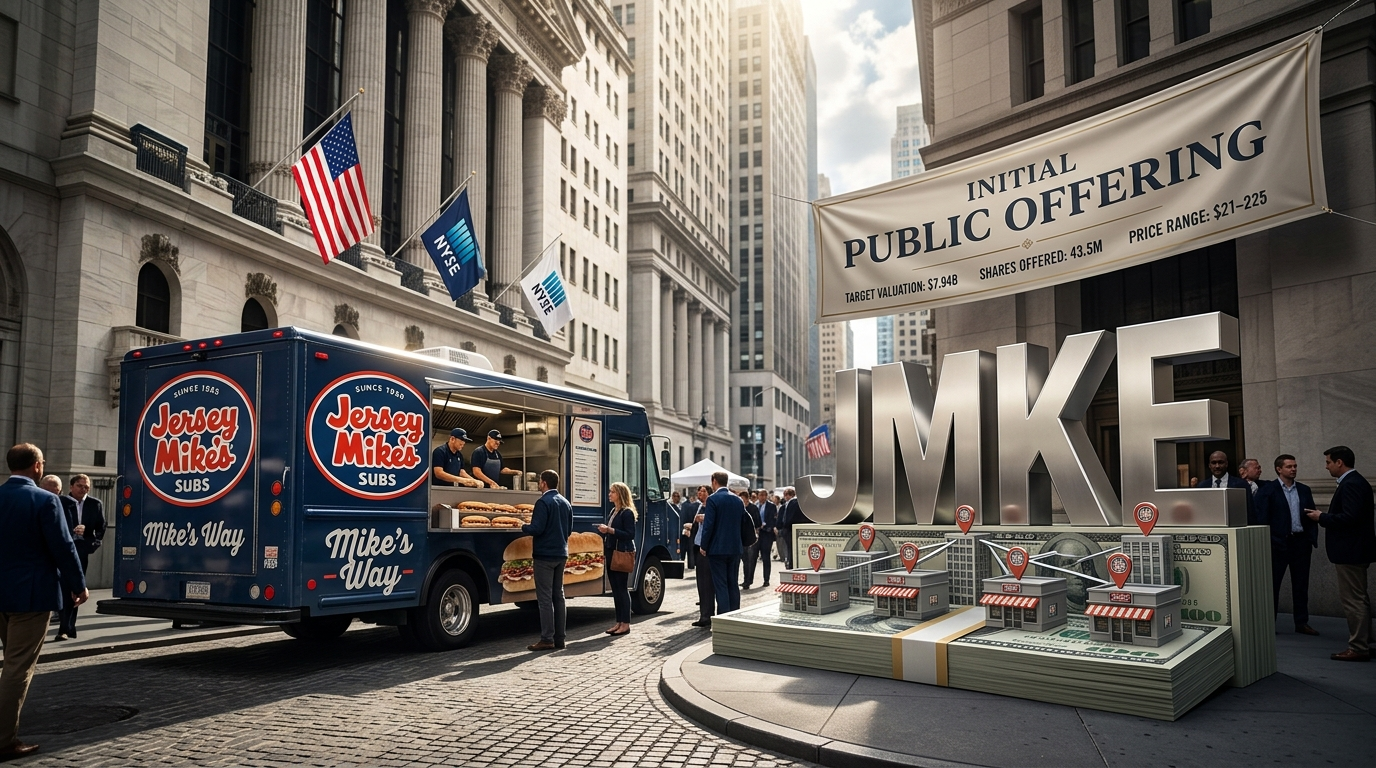
On July 20, 2026, Reuters reported that Jersey Mike’s Subs publicly disclosed IPO terms, including an NYSE listing for Jersey Mike's Subs under ticker JMKE. The term sheet contemplates 43.5 million shares priced in a $21–$25 range, targeting up to a $7.94B valuation and up to $1.09B of proceeds.
Target valuation (top of range)
$7.94B
Implied by the disclosed term sheet
Shares offered
43.5M
Total shares in the disclosed offering size
Price range
$21–$25
Per share for the marketed-deal phase
Proceeds (top of range)
$1.09B
Up to what the company targets to raise
Key IPO process details (as disclosed)
Ticker / exchange
[Jersey Mike's Subs](jmke) / NYSE
Reported as JMKE on the NYSE
Joint book-running managers
[Morgan Stanley](ms), [Jefferies Financial](jef), [JPMorgan Chase](jpm)
Named in Reuters reporting
S-1 originally filed
July 2, 2026
Public registration statement filed on SEC EDGAR
Business model
This IPO isn’t priced like a ‘restaurant operator’—it’s priced like a franchise royalty engine
Jersey Mike’s’ S-1 describes a highly franchised, asset-light model, which matters because it changes what cash flows investors should focus on: royalties and related franchise economics rather than labor-heavy restaurant margins. In fiscal 2025, the company reported $4.217B of systemwide sales with an average unit volume (AUV) of $1.364M.
| Metric | Fiscal 2025 | 13 weeks ended Mar 29, 2026 |
|---|---|---|
| Systemwide sales | $4.217B | $1.097B |
| Average unit volume (AUV) | $1.364M | $1.368M |
| Store count | 3,256 (as of Dec 28, 2025) | 3,300 (as of Mar 29, 2026) |
| Company-owned stores (asset intensity) | 36 (out of 3,300 as of Mar 29, 2026) | 36 (out of 3,300 as of Mar 29, 2026) |
Profitability bridge
Adjusted EBITDA margins near ~47% support a premium—if those margins are stable as growth continues
The S-1 reports adjusted EBITDA of $327M for fiscal 2025 (successor) with a 47% margin, and $84M for the 13 weeks ended Mar 29, 2026 (45% margin). For investors, the key question is whether those margins come from franchise economics that can remain resilient through commodity inflation and wage pressure.
| Metric | Fiscal 2025 (successor) | 13 weeks ended Mar 29, 2026 |
|---|---|---|
| Adjusted EBITDA | $327M | $84M |
| Adjusted EBITDA margin | 47% | 45% |
| Revenue (reference, S-1 reported) | $696M (fiscal 2025 successor; plus $28M predecessor) | $185M (13 weeks ended Mar 29, 2026) |
- If franchise economics are the primary driver, margins can be structurally higher than typical company-operated restaurant models.
- The risk isn’t whether the chain can sell sandwiches—it’s whether the royalty-based profitability stays insulated as the unit base scales and as any mix shifts occur (domestic vs. international, new store ramp vs mature stores).
- Because adjusted EBITDA is not the same as GAAP earnings, investors should watch reconciliation details in the S-1 rather than rely on a single margin snapshot.
Why Blackstone is central to the story
Blackstone’s PE playbook is visible in the structure: monetization now, growth contingencies later
Blackstone backed Jersey Mike’s and (per Fortune context) the sponsor/exit economics appear tightly connected to the IPO process. The S-1-based disclosures in this session also point to an earn-out structure tied to store growth, meaning some of the ‘full value’ is realized only if the brand scales.
| Mechanic | What it does | Disclosed figure / trigger |
|---|---|---|
| Sponsor acquisition context | Sponsor acquired a majority stake pre-IPO (context for why Blackstone is selling into the listing) | $8B acquisition context referenced in Fortune reporting |
| Earn-out (contingent liability) | Pays additional value based on store growth milestone or change in control | Max $250M; triggered when global stores reach 4,000 or upon change in control |
| Tax receivable agreement (TRA) | Creates a mechanism to pass realized tax benefits to pre-IPO owners | TRA disclosed in S-1 summary extracted during this session |
Valuation logic
At the top of the range, the deal is priced for durable unit economics—meaning the market will scrutinize AUV like a hawk
A simple investor mental model is: if systemwide sales per unit are high and stable, franchise royalty economics can support premium multiples even when restaurant operations remain lower-margin. The S-1 data in this session gives investors a hard reference point: AUV of ~$1.36M and systemwide sales of $4.217B in fiscal 2025.
Systemwide sales scale (anchor points for unit economics)
S-1 reported systemwide sales and AUV show the ‘scale without heavy owned-store capital’ profile the market will price.
Unidad: USD
Fiscal 2025 systemwide sales
S-1 reported $4.217B
4,217,000,000
13 weeks ended Mar 29, 2026 systemwide sales
S-1 reported $1.097B
1,097,000,000
Fiscal 2025 average unit volume (AUV)
S-1 reported $1.364M
1,364,000
13 weeks ended Mar 29, 2026 AUV
S-1 reported $1.368M
1,368,000
- AUV stability across the two measurement windows (AUV near $1.36M in both) reduces the ‘growth quality’ risk that haunts many fast-casual IPOs.
- The biggest investor uncertainty is whether scaling to thousands of stores (including the 4,000-store earn-out threshold) keeps economics intact once the pipeline shifts toward newer franchisees and new geographies.
- Because this is a franchise-led model (36 company-owned stores out of 3,300), investors should expect performance sensitivity to franchisee-level health (fees paid, royalty collectability) rather than only to corporate labor and rent.
Consumer demand vs. franchise constraints
The macro bet is ‘consumer discretionary still spends,’ but the micro bet is franchise execution
The timing of the IPO (consumer-capital-markets appetite) is headline-grabbing, but the underlying operating wager is narrower: Jersey Mike’s needs franchise execution and development pipeline conversion. The S-1 summary extracted here indicates a growth target of 8–10% annual net store growth with a development pipeline exceeding 1,600 stores.
| Item | Target / status | Detail from disclosed S-1 summary |
|---|---|---|
| Net store growth target | 8–10% annually | S-1 summary extracted during session |
| Development pipeline | >1,600 stores | S-1 summary extracted during session |
| Pipeline ownership | 90% by existing franchisees | S-1 summary extracted during session |
| International expansion | Canada + UK/Ireland agreements | 300-store development agreement in Canada and 300-store agreement for UK and Ireland |
Deal mechanics and who gets paid
Use of proceeds is debt-focused—so the market is underwriting ‘balance sheet + growth’ rather than immediate per-share accretion
The S-1 summary extracted during this session indicates IPO proceeds will be used to pay down specific notes (Series 2026-1 Class A-2-I and A-2-II notes). In a franchise model, deleveraging can improve financial resilience, but it also reinforces that the IPO’s near-term “value creation” is partly balance-sheet engineering.
| Use of proceeds | Target instruments | What it implies |
|---|---|---|
| Debt repayment (net of underwriting discounts/commissions) | Series 2026-1 Class A-2-I and A-2-II Notes | Lower leverage risk for an asset-light franchise platform |
| Contingent liabilities embedded in the capital structure | Earn-out up to $250M (4,000-store trigger or change in control) | Future payments tied to scale, not just immediate GAAP profitability |
Upstream/downstream supply chain map
Jersey Mike’s sits in a ‘limited-capex’ consumer supply chain—but its franchise model still depends on real-world operational inputs
Even though Jersey Mike’s is mostly franchised (and asset-light), its customers’ sandwich demand still flows through physical upstream supply chains: protein, produce, packaging, logistics, and restaurant equipment. Downstream, the franchise channel depends on landlord/space availability and the ability of franchisees to execute labor and local procurement.
| Layer | What matters | Named entities (listed, in research scope or typical public comparables) | Why it ties back to the IPO thesis |
|---|---|---|---|
| Upstream: packaged/processed food inputs & logistics | Cost inflation, supply continuity, packaging availability | Tyson Foods, Sysco | If input costs rise faster than franchise royalty coverage, franchisee margins can compress and threaten openings/maintenance |
| Upstream: equipment/operations procurement | Capital goods availability and unit economics for new store builds | Snap-on, Middleby | Equipment lead times can slow development pipeline conversion; franchise build delays push out royalty ramp |
| Downstream: consumer demand channel | Traffic and discretionary spend elasticity | McDonald’s, Yum! Brands | These are public benchmarks for how the broader fast-casual/limited-service ecosystem holds up during consumer slowdowns |
Second-order corporate governance
Founder-family compensation disclosures are a governance signal the market will digest alongside the growth story
Fortune reporting based on the IPO filing highlights substantial compensation paid to founder-family members between 2023 and 2025. Even if the payments are contractually disclosed, investors often treat these as a governance and incentive-structure signal during IPO valuation.
| Person (as reported) | Compensation disclosed | Time window / source context |
|---|---|---|
| Stepson (Phillip Sivolobov) | $50.5M | 2023–2025; Fortune reporting |
| Brother (John Cancro) | ~$21M | 2023–2025; Fortune reporting |
| Brother-in-law (Daniel Powers) | >$31M | 2023–2025; Fortune reporting |
What to watch after pricing
The post-IPO ‘watch list’ is development conversion, AUV durability, and whether deleveraging changes the risk profile
- AUV trend: does it stay near ~$1.36M as the store count grows beyond today’s base?
- Store development conversion: does the >1,600 pipeline open on the expected cadence (and is it still 90% anchored by existing franchisees)?
- Earn-out track: global store progress toward 4,000 (earn-out max $250M) and whether timing shifts from openings to capital structure events.
- Leverage and coverage: post-IPO debt repayment against the disclosed notes, and how that changes fixed-charge resilience during any consumer downturn.
- International build-out: whether Canada and UK/Ireland agreements translate into revenue ramp without margin dilution.