
%22%2F%3E%0A%20%20%3Ccircle%20cx%3D%22220%22%20cy%3D%22150%22%20r%3D%22180%22%20fill%3D%22%2322d3ee%22%20fill-opacity%3D%220.12%22%2F%3E%0A%20%20%3Ccircle%20cx%3D%221010%22%20cy%3D%22130%22%20r%3D%22220%22%20fill%3D%22%2338bdf8%22%20fill-opacity%3D%220.08%22%2F%3E%0A%20%20%3Ccircle%20cx%3D%22920%22%20cy%3D%22520%22%20r%3D%22170%22%20fill%3D%22%2322d3ee%22%20fill-opacity%3D%220.06%22%2F%3E%0A%20%20%3Cpath%20d%3D%22M140%20430h920%22%20stroke%3D%22url(%23line)%22%20stroke-width%3D%2212%22%20stroke-linecap%3D%22round%22%2F%3E%0A%20%20%3Cpath%20d%3D%22M220%20360c120-150%20260-220%20380-220s260%2070%20380%20220%22%20fill%3D%22none%22%20stroke%3D%22%2367e8f9%22%20stroke-opacity%3D%220.5%22%20stroke-width%3D%2216%22%20stroke-linecap%3D%22round%22%20stroke-linejoin%3D%22round%22%2F%3E%0A%20%20%3Cpath%20d%3D%22M300%20398h600%22%20stroke%3D%22%2394a3b8%22%20stroke-opacity%3D%220.24%22%20stroke-width%3D%228%22%20stroke-linecap%3D%22round%22%2F%3E%0A%20%20%3Ctext%20x%3D%22220%22%20y%3D%22510%22%20fill%3D%22%23e2e8f0%22%20fill-opacity%3D%220.7%22%20font-family%3D%22Arial%2C%20Helvetica%2C%20sans-serif%22%20font-size%3D%2238%22%20letter-spacing%3D%228%22%3EINSIGHTS%3C%2Ftext%3E%0A%3C%2Fsvg%3E)
What happened (and what it really is)
Wistron didn’t build a chip fab—it built a system-assembly-and-test “bridge” inside NVIDIA’s AI factory network
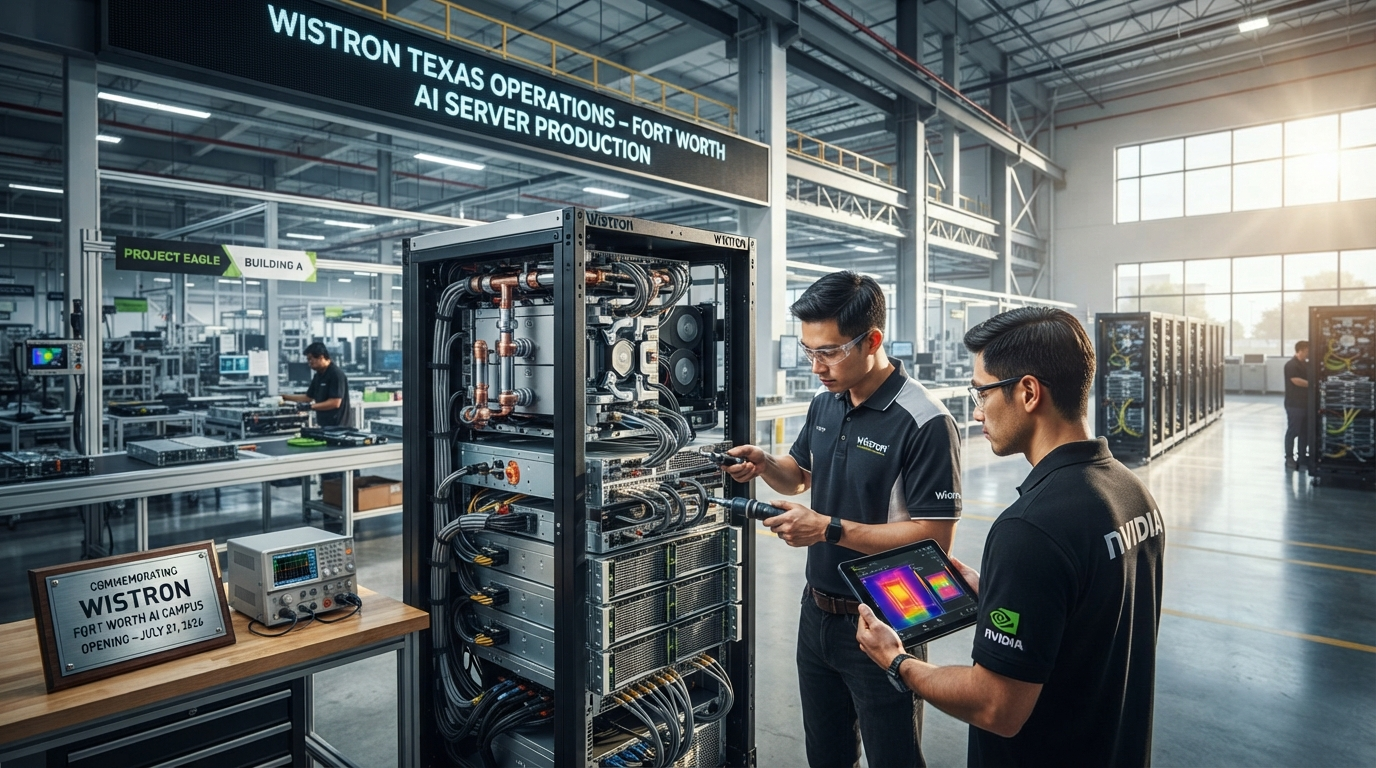
On July 21, 2026, Wistron opened its first U.S. manufacturing facility in Fort Worth, Texas, as a $700M step in domestic AI infrastructure scaling. The facility is designed to assemble and test NVIDIA AI systems—specifically targeting NVIDIA’s GB300 Grace Blackwell Ultra Superchip and Vera Rubin Superchip production.
Facility investment
$700M
Fort Worth facility; company/NVIDIA-reported
Facility size
324,000 sq ft
D1 facility footprint
Opened
2026-07-21
Grand opening / U.S. plant launch
Primary output
AI system assembly & test
For NVIDIA GB300 & Vera Rubin systems
Key launch facts
Location
Fort Worth, Texas
U.S. facility
Strategic role
Assemble + test NVIDIA AI systems
Not semiconductor manufacturing
Chips referenced
GB300 Grace Blackwell Ultra; Vera Rubin
Superchip focus
Job ramp
500+ initial; 1,000 targeted by year-end
U.S. employment plan
Supply-chain mapping
This shift primarily reroutes the bottleneck from chip logistics to systems integration, verification, and ramp speed
Domestic AI infrastructure scaling works only if the hard parts—test coverage, defect detection, thermal performance, and line balancing—scale at U.S. cadence. Wistron’s stated approach leans on digital twins and accelerated simulation to de-risk ramp, which is exactly where “Asia-only” manufacturing often masks complexity via embedded learning-curve effects.
| Supply-chain layer | What changes with Texas assembly/test | What likely doesn’t change | Why it matters |
|---|---|---|---|
| GPU/accelerator silicon | Mostly not the Texas factory’s job | Chip manufacturing remains in existing semiconductor fabs | So the move targets system-level constraints, not wafer supply. |
| System integration (boards, assemblies) | Better proximity to U.S. deployments; faster scheduling | Same core platforms/components may still be sourced globally | Integration lead time and scheduling risk can drop. |
| Validation & test | Potentially shorter feedback loops; tighter iteration | Test equipment supply remains global | If yield improves or ramps faster, capacity becomes “real” sooner. |
| Thermal / liquid-cooling readiness | U.S. lines must execute platform-specific thermal design reliably | Cooling components may still be sourced globally | A single thermal yield miss can erase lead-time gains. |
| Deployment cadence / logistics | Reduced cross-ocean dependency for finished systems | Some components (memory, interconnect) still cross borders | Domestic assembly can reduce whole-system shipping latency and customs risk. |
| Cash conversion cycle (working capital) | May worsen during ramp due to inventory build + receivables | Not automatically improved by geography | Investors should watch working-capital drag alongside capex ramp. |
- Wistron’s Texas plant is an integration-and-test bridge inside the AI supply chain, not a semiconductor manufacturing reset.
- If the bottleneck shifts to U.S.-based validation and ramp yield, Wistron’s ability to scale processes becomes a proxy for NVIDIA system capacity entering service faster.
- The most “investable” risk is not whether chips exist—it’s whether domestic lines can hit throughput and defect targets quickly enough to sustain orders through 2026–2027.
Scale math that investors can actually use
The $700M price tag only looks rational if the line reaches high utilization quickly—yet Wistron’s cash flow profile suggests ramp could strain working capital
A domestic factory becomes a competitive advantage only if it can ramp like a production line, not like a one-off build. Financials don’t prove the Texas ramp will succeed, but they do show whether Wistron can fund and absorb a ramp without distorting cash flow.
Wistron profitability vs. cash generation (selected years)
Illustrative using tool-retrieved annual/TTM data; cash flow can diverge sharply from earnings during ramp and working-capital swings.
Unidad: TWD
Wistron Net income (FY 2022)
TWD
11,162,451,000
Wistron Net income (FY 2024)
TWD
17,445,591,000
Wistron Net income (FY 2025)
TWD
27,408,097,000
Wistron Net income (TTM through 2026-07-22)
TWD
64,624,138,000
Wistron Operating cash flow (FY 2024)
TWD
5,749,828,000
Wistron Operating cash flow (FY 2025)
TWD
-105,809,663,000
Wistron Operating cash flow (TTM through 2026-07-22)
TWD
-219,190,767,000
| Metric (TTM / FY) | Value | What it implies for a Texas ramp |
|---|---|---|
| Operating cash flow (TTM through 2026-07-22) | -219,190,767,000 TWD | Ramp + inventory/receivables dynamics can overwhelm operating cash in the near term. |
| Free cash flow (TTM through 2026-07-22) | -264,354,000,000 TWD | Domestic scale efforts may not be cash-accretive immediately. |
| Investments in PP&E (TTM through 2026-07-22) | -46,048,030,000 TWD | Capex intensity is consistent with scaling manufacturing capacity. |
| Inventory (TTM through 2026-07-22) | 611,556,413,000 TWD | If inventory grows faster than revenue during ramp, cash conversion can deteriorate. |
| Accounts receivable (TTM through 2026-07-22) | 567,854,669,000 TWD | Receivables build can indicate longer collection cycles or front-loaded production. |
Why now (mid-2026): what digital twin + testing de-risking targets
Wistron’s “digital twin first” approach is an attempt to compress the hardest part of domestic scaling: iteration speed
A U.S. line has to learn fast, because mistakes are expensive when you’re building brand-new throughput capacity. In this case, Wistron (with NVIDIA technology) positions the plant as fully designed/simulated using digital twins before/around construction—essentially trying to shorten the time between “design intent” and “production reality.”
| Mechanism | What it targets in manufacturing | Why it matters specifically for AI systems |
|---|---|---|
| Digital twin / simulation-driven design | Thermal, mechanical, and process layout validation before full production | AI servers are thermally and electrically sensitive; fixing issues later is costly. |
| Advanced simulation speedups | Shorter engineering cycles and faster iteration between design/test outcomes | Throughput ramp depends on how fast you remove production bottlenecks. |
| AI-assisted optimization (energy/defect detection claims) | Higher reliability and potentially better energy efficiency during operations | Operational reliability determines customer re-order confidence and warranty risk. |
- Domestic AI capacity isn’t just about building hardware—it’s about reproducing process stability and inspection quality at scale.
- Simulation/virtual verification can reduce costly “factory floor surprises” when moving integration work to a new geography.
- The key watch-item is whether these de-risking measures translate into stable throughput and improved cash conversion during 2026.
Multi-plant reality check
The $761M multi-site Fort Worth plan shows this isn’t a one-off ‘open the doors’ moment—it’s a ramp infrastructure commitment
The $700M opening facility is part of a broader Fort Worth program reported as a $761M investment across two AI supercomputer manufacturing sites. That matters because investors should treat the Texas effort as a multi-site ramp, not a single line start.
| Site / Identifier | Reported footprint | Investment commitment | Timing / status |
|---|---|---|---|
| Primary building (35 Eagle / Project Eagle) | 324,598 sq ft | $580M (allocated for land/purchase/improvements) | Operations opened / ramp aligned with early 2026 plan |
| Secondary building (Westport 14 / Project Westport) | 766,994 sq ft | $181M (allocated for land/purchase/improvements) | Expected to align with the ramp timeline for early 2026 |
| Total program | ≈1,091,592 sq ft | $761M total investment | Jobs and investment commitments extend into end-2026 |
- The multi-site structure increases the probability that throughput ramps rather than remains constrained by one bottleneck.
- However, multi-site ramps also increase operational complexity—especially inventory and receivables exposure during transition to sustained production.
- The tax-structure details in local documentation (10-year terms, performance-based abatements) highlight that meeting investment and job milestones is part of the economic model.
Competitive positioning and second-order effects
Domestic assembly favors suppliers who can reduce integration risk—not just suppliers who can sign a contract
Wistron’s contract position as an NVIDIA manufacturing partner is necessary, but not sufficient. The advantage accrues only if Wistron can outperform or de-risk rival capacity on (1) defect/yield, (2) speed-to-ramp, and (3) supply-chain responsiveness when components or logistics fluctuate.
| Supply-chain neighbor | Role | Likely impact from Wistron’s U.S. system factory | Type of linkage |
|---|---|---|---|
| NVIDIA | Platform + system requirements | Potentially faster domestic system capacity enters customer deployment if integration/test bottlenecks fall | Direct partnership; system assembly/test support |
| Foxconn | Electronics manufacturing partner (reported in coverage) | Could face more competition for U.S. assembly/test volume if domestic lines prove scalable | Downstream rivalry within U.S. system build ecosystem |
| TSMC | Chip manufacturing (indirect) | Demand is not eliminated; however, better system scheduling could smooth downstream system build timing | Upstream dependency that remains mostly global |
| Cadence | Digital twin / simulation platform (reported integration) | Higher enterprise use of simulation workflows strengthens value proposition around AI infrastructure design/test | Tooling supplier to de-risk design & operations |
| Wiwynn | AI factory infrastructure / platforms (reported adjacency) | Could be affected by shifts in who becomes fastest to deliver rack-scale capabilities domestically | System-infrastructure competitor/adjacent ecosystem |
| Hillwood | Industrial development partner (reported) | Local industrial project execution; less of a technology dependency but critical to site readiness | Local infrastructure enablement |
What to watch next (1–3 year window)
The success metric isn’t ‘factory opened’—it’s whether Wistron’s domestic lines improve throughput without worsening cash conversion permanently
- Utilization and yield: Are throughput and defect rates stabilizing after the July 2026 opening (and when the second site ramps)?
- Cash conversion: Does inventory/receivables normalize in later 2026 and 2027, or does the ramp keep operating cash flow negative?
- Ramps timing vs. plan: Does production ramp match the stated early-2026 operational target for both sites?
| Milestone | What ‘good’ looks like | What ‘bad’ looks like |
|---|---|---|
| Post-launch revenue contribution | AI-related revenue grows and margin pressure is contained | Revenue recognition lags capex, and working capital expands faster than sales |
| Operating cash flow trend | Operating cash flow improves as ramp matures | Operating cash flow stays materially negative due to inventory/receivables build |
| Second site steady-state | Both facilities reach sustained output; utilization rises | Only one facility proves viable; second site underutilized |
| Customer re-order confidence | Evidence of sustained demand through 2027-like ordering patterns (company/NVIDIA signals) | 订单/volume fails to sustain; domestic lines become a fixed-cost burden |
The domestic scaling thesis is directionally credible because it targets integration/test and iteration speed—exactly the kind of friction that delays “real capacity.” But the market should price the outcome like an execution bet: success likely shows up first in cash conversion and throughput stability, not in headline capex.