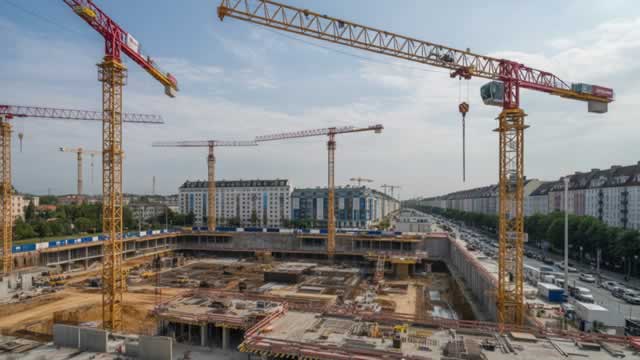
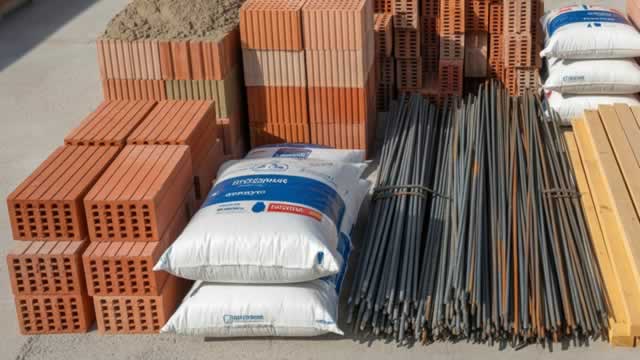
BlueLinx Holdings Inc., que opera junto con sus diversas divisiones, es un destacado proveedor de materiales de construcción para proyectos residenciales y ...
BlueLinx Holdings Inc., operating through its wholly-owned subsidiary BlueLinx Corporation, is a prominent wholesale distributor of building products in the United States. Founded in 2004 and headquartered in Marietta, Georgia, the company provides a comprehensive portfolio of over 10,000 specialty and commodity building products from well-respected brands, as well as ...BlueLinx Holdings Inc., operating through its wholly-owned subsidiary BlueLinx Corporation, is a prominent wholesale distributor of building products in the United States. Founded in 2004 and headquartered in Marietta, Georgia, the company provides a comprehensive portfolio of over 10,000 specialty and commodity building products from well-respected brands, as well as private-label offerings. Its product range includes engineered wood, lumber, plywood, oriented strand boards (OSB), rebar, insulation, metal products, cedar, trim, cladding, and other structural components essential for both residential and commercial construction.
BlueLinx serves a diverse customer base, including independent dealers, specialized distributors, major home improvement retailers, and pre-fabricated housing manufacturers. The company operates as a two-step distributor, supplying materials to dealers who then serve contractors and builders, and also directly to large retail chains. With a vast logistics network of strategically located distribution facilities across the U.S., BlueLinx ensures efficient delivery and supply chain solutions for its clients.
Financially, BlueLinx has demonstrated resilience in the cyclical building materials industry. As of the latest TTM data, the company reported a market capitalization of approximately $699 million, with revenue per share of $385.36. Despite a slight negative net profit margin (-0.1%), the company maintains a strong current ratio of 4.007 and a debt-to-equity ratio of 1.08, indicating manageable leverage. Free cash flow per share stands at $7.43, with a free cash flow yield of 8.3%, reflecting capacity for reinvestment and shareholder returns. The company has also paid dividends, with the last dividend at $5.00 per share.
Leadership is headed by President and CEO Shyam K. Reddy, who assumed the role in March 2023. Prior to his current position, he served in various executive roles, bringing extensive experience. The executive team includes Chief Human Resources Officer Keisha Duck, Chief Information Officer Praveen Gautam, and other key leaders. BlueLinx employs approximately 2,160 full-time employees, classified as a mid-sized company in the distribution sector.
The company is committed to providing value-added services, including logistics, inventory management, and marketing support, to enhance customer and vendor partnerships. With its strong market position, extensive product breadth, and robust distribution network, BlueLinx is well-positioned to capitalize on U.S. construction and remodeling demand, while navigating economic cycles through strategic cost management and operational efficiency.
Plutux no es un asesor de inversiones. Los datos de mercado y el análisis generado por IA son solo informativos y educativos, no asesoramiento de inversión. Aviso legal
InteranualYoY significa Year-over-Year (interanual). Compara el último valor anual con el valor anual anterior para mostrar la fortaleza de la tendencia a largo plazo.
TrimestralQoQ significa Quarter-over-Quarter (intertrimestral). Compara el último trimestre con el trimestre inmediatamente anterior para mostrar cambios de impulso a corto plazo.
IngresosEl dinero total que entró por la puerta principal al vender cosas, antes de pagar una sola factura. Piensa en esto como el gran total de cada compra con tarjeta de los clientes. (YoY compara el rendimiento de este año con el del año pasado, mientras que QoQ compara los tres meses actuales con los tres anteriores).
$3.0B
+0.0%
+11.3%
Beneficio netoEl resultado final absoluto. Si la empresa pagara a cada proveedor, empleado, banquero y recaudador de impuestos, este es el dinero real que queda en su bolsillo al final del día.
$219000
-99.6%
+539.4%
Margen brutoEl margen básico. Si venden unas zapatillas de 100 dólares, este porcentaje indica cuánto de ese precio es ganancia justo después de pagar el caucho y los cordones, pero antes de pagar el alquiler de la tienda o los anuncios de televisión.
+15.3%
-7.7%
+7.8%
Margen operativoLa puntuación de eficiencia del 'trabajo diario'. De cada dólar que gasta un cliente, esto muestra cuántos centavos mantiene la empresa después de fabricar el producto Y pagar todos los gastos generales corporativos (como salarios, marketing y mantener las luces encendidas).
+1.1%
-62.9%
+152.5%
Margen netoEl porcentaje final que se lleva a casa. Cuando se eliminan todos los costos concebibles, impuestos y pagos de intereses, este es el número exacto de centavos que la empresa realmente se queda de cada dólar en ventas.
+0.0%
-99.6%
+494.6%
Flujo de caja libreEl santo grial del efectivo corporativo. Es el dinero físico gastable que queda después de que el negocio paga sus operaciones diarias Y compra las actualizaciones grandes y costosas (como nuevas fábricas o servidores) que necesita para sobrevivir. Este es el dinero 'libre' que pueden usar para pagar dividendos o recomprar acciones.
$32.9M
-27.1%
+114.7%
Margen FCFLa tasa definitiva de conversión de efectivo. Muestra qué tan buena es la empresa para convertir ventas regulares directamente en efectivo frío, duro y gastable. Un porcentaje alto significa que el negocio es una auténtica máquina de imprimir dinero.
+1.1%
-27.1%
+113.2%
Deuda/PatrimonioEl indicador de riesgo financiero. Compara cuánto del imperio de la empresa se construyó con dinero prestado (préstamos) frente al dinero propio de los propietarios (accionistas). Un número alto significa que están muy apalancados y juegan un juego más arriesgado; un número bajo significa que juegan a lo seguro.
109.2%
+10.9%
-0.3%
Ratio corrienteLa verificación de supervivencia de 12 meses. Simplemente compara el efectivo que tienen ahora mismo (más cosas que pueden convertirse rápidamente en efectivo) con las facturas inmediatas que absolutamente deben pagar este año. Una puntuación superior a 1 significa que tienen suficiente en la billetera para cubrir las próximas facturas sin entrar en pánico.
4.66x
-4.0%
+2.8%
Activos totalesEl tamaño absoluto del imperio de la empresa. Agrupa absolutamente todo lo valioso que poseen, desde el efectivo en la caja registradora y el inventario en el almacén, hasta las patentes de software en la bóveda y las fábricas en el suelo.
Operator: Ladies and gentlemen, thank you for standing by, and welcome to the BlueLinx Holdings Inc. First Quarter 2026 Earnings Conference Call. At this time, all participants are in a listen-only mode, and today’s call is being recorded. We will begin with opening remarks and introductions. At this time, I would like to turn the conference over to your host, Investor Relations Officer, Thomas C. Morabito. Please go ahead.
Thomas C. Morabito: Thank you, Operator, and welcome to the BlueLinx Holdings Inc. first quarter 2026 earnings call. Joining me on today’s call are Shyam K. Reddy, our Chief Executive Officer, and Christopher Kelly Wall, our Chief Financial Officer and Treasurer. At the end of today’s prepared remarks, we will take questions. Our first quarter news release and Form 10-Q were issued yesterday after the close of the market, along with our webcast presentation, and these items are available in the Investors section of our website. We encourage you to follow along with the detailed information on the slides during our discussion. Today’s discussion contains forward-looking statements. Actual results may differ significantly from those forward-looking statements due to various risks and uncertainties, including the risks described in our most recent SEC filings. Today’s presentation includes certain non-GAAP and adjusted financial measures that we believe provide helpful context for investors evaluating our business. Reconciliations to the closest GAAP financial measure can be found in the appendix of our presentation. Now I will turn it over to Shyam.
Shyam K. Reddy: Thanks, Tom. Good morning, everyone. We are off to a good start in 2026, as our first quarter results reflect our ability to compete effectively and deliver positive performance despite market headwinds, unforeseen cost inflation, and competitive pricing pressure. Our disciplined approach to executing our channel and product strategies enabled us to manage margins and to continue growing volumes across multiple product categories and key customer channels. During the first quarter, revenues increased 3% year-over-year, driven primarily by Distero specialty sales and higher volumes in our key specialty product categories, which helped offset ongoing pricing pressure in specialty and structural products and margin pressure in specialty products. Specialty and structural gross margins were 18.1% and 10.9%, respectively, reflecting the strength of our customer value proposition and effective inventory management. Our specialty product strategy continues to deliver results, with engineered wood, siding, millwork, industrial, outdoor living products, and other specialty products representing 70% of net sales and approximately 80% of gross profit in the quarter. While overall market conditions remain soft, our deliberate alignment of key supplier branded product expansion with strategic channel growth initiatives is enabling us to drive better commercial outcomes and …