
%22%2F%3E%0A%20%20%3Ccircle%20cx%3D%22220%22%20cy%3D%22150%22%20r%3D%22180%22%20fill%3D%22%2322d3ee%22%20fill-opacity%3D%220.12%22%2F%3E%0A%20%20%3Ccircle%20cx%3D%221010%22%20cy%3D%22130%22%20r%3D%22220%22%20fill%3D%22%2338bdf8%22%20fill-opacity%3D%220.08%22%2F%3E%0A%20%20%3Ccircle%20cx%3D%22920%22%20cy%3D%22520%22%20r%3D%22170%22%20fill%3D%22%2322d3ee%22%20fill-opacity%3D%220.06%22%2F%3E%0A%20%20%3Cpath%20d%3D%22M140%20430h920%22%20stroke%3D%22url(%23line)%22%20stroke-width%3D%2212%22%20stroke-linecap%3D%22round%22%2F%3E%0A%20%20%3Cpath%20d%3D%22M220%20360c120-150%20260-220%20380-220s260%2070%20380%20220%22%20fill%3D%22none%22%20stroke%3D%22%2367e8f9%22%20stroke-opacity%3D%220.5%22%20stroke-width%3D%2216%22%20stroke-linecap%3D%22round%22%20stroke-linejoin%3D%22round%22%2F%3E%0A%20%20%3Cpath%20d%3D%22M300%20398h600%22%20stroke%3D%22%2394a3b8%22%20stroke-opacity%3D%220.24%22%20stroke-width%3D%228%22%20stroke-linecap%3D%22round%22%2F%3E%0A%20%20%3Ctext%20x%3D%22220%22%20y%3D%22510%22%20fill%3D%22%23e2e8f0%22%20fill-opacity%3D%220.7%22%20font-family%3D%22Arial%2C%20Helvetica%2C%20sans-serif%22%20font-size%3D%2238%22%20letter-spacing%3D%228%22%3EINSIGHTS%3C%2Ftext%3E%0A%3C%2Fsvg%3E)
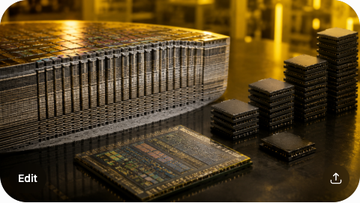
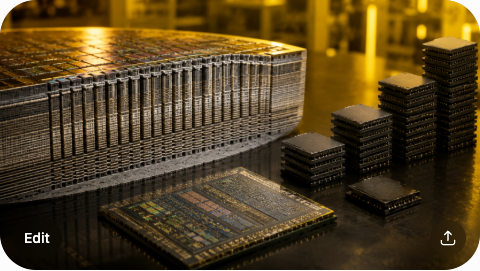
Industry structure
NAND is a $67B/year industry with 5 commercial IDMs, 2 latent Chinese challengers (YMTC/CXMT), and one functional duopoly at the leading edge - and the AI cycle has finally broken the 25-year commodity pattern.
The NAND flash market is a $67B/year industry in 2025 (TrendForce) - smaller than DRAM ($118B) and dramatically smaller than the overall semiconductor market ($680B), but structurally the most cyclical memory sub-segment and the only one where AI demand has materially broken the commodity pricing pattern. Five integrated device manufacturers (IDMs) effectively control 99% of merchant NAND bit supply: Samsung Electronics (29% revenue share), Kioxia (20%), SK hynix (19%, via Solidigm), Micron (16%), and Sandisk (13%). Two Chinese challengers - YMTC and CXMT - have built meaningful share in mature nodes (YMTC reached ~10-13% NAND shipment share by late 2025) but remain 2-3 generations behind at the leading edge due to US equipment sanctions.
The 2025 inflection is structural, not cyclical. For 25 years NAND ASPs followed a clean Wright's Law decay curve (a roughly -30% to -40% price drop per generation of bit-density doubling), and the 2023 trough saw industry revenue contract ~38% YoY. The 2025-2026 recovery is different: AI training and inference workloads (driven by Nvidia H100/H200/B100, AMD MI300/MI325, and the inference cluster buildout at hyperscalers) need persistent storage for model weights, KV cache, embedding tables, and vector databases. This demand is latency-tolerant but capacity-hungry - a perfect match for high-density QLC/PLC NAND. The result is that AI-driven NAND demand grew from ~12% of total bit demand in 2023 to ~32% in 2026E, and that mix shift is the structural reason ASPs have held above the historical Wright's Law decay curve for 6+ consecutive quarters.
The customer base is more concentrated than ever. Top 5 NAND buyers (Apple, the 4 US hyperscalers - Microsoft/Amazon/Alphabet/Meta - plus Dell Technologies) account for roughly 48% of merchant NAND bit demand. AI training clusters (driven by Nvidia DGX SuperPOD and Meta LLM clusters) now anchor multi-year purchase commitments, and the secondary SSD controller market (Marvell, Silicon Motion, Phison) has consolidated around AI-grade PCIe Gen5/Gen6 controller roadmaps.
The cell-stack and node roadmap
The NAND cell architecture is the cleanest example of how a single materials-science constraint (charge trap vs. floating gate, layer count vs. aspect ratio) determines the entire industry capital allocation cycle.
Every NAND bit lives in a floating-gate or charge-trap transistor. The cell stores charge on an insulated gate; reading the cell measures the threshold voltage. SLC stores 1 bit/cell, MLC 2 bits, TLC 3 bits, QLC 4 bits, and PLC 5 bits. Each additional bit per cell adds 2^bits possible threshold-voltage states, which compresses the voltage margin and exponentially raises error-correction cost. That's why the cell roadmap is: SLC (enterprise) -> MLC (legacy) -> TLC (mainstream) -> QLC (AI read-intensive) -> PLC (AI archive, sampling in 2026). The error-correction code (ECC) budget goes from BCH for SLC to LDPC for TLC/QLC to advanced LDPC + AI-prediction for PLC. This is why NAND controller silicon (Marvell, Silicon Motion, Phison) is increasingly the moat - not the cell itself.
The other binding constraint is the 3D layer stack. NAND fabs etch deep, narrow holes through alternating layers of oxide and nitride (or polysilicon) to build vertical NAND strings. The deeper the stack, the higher the aspect ratio of the etch, and the harder the process. Samsung's V-NAND roadmap went from 64L (2014) -> 92L -> 128L -> 176L -> 238L (V8) -> 290L (V9, 2025) -> rumored 430L (V10, 2026-2027). SK hynix's roadmap: 72L -> 96L -> 128L -> 176L -> 238L (V9, 2025) -> 321L (V10, 2026E). Micron's: 128L -> 176L -> 232L (G9, 2025) -> 280L+ (2026-2027E). Kioxia's BiCS Flash: 64L -> 96L -> 112L -> 162L -> 218L (Gen 7, 2024) -> 290L+ (Gen 8, 2025-2026E). The competitive read is: Samsung leads in absolute layer count, SK hynix leads in cell-current per layer, Micron leads in planar scaling, and Kioxia leads in cost-per-GB.
The node roadmap is also where the geopolitical bifurcation shows up. YMTC (China) has shipped 128L TLC in volume and is sampling 232L - exactly one generation behind the leading edge. CXMT (China) is more focused on DRAM but has built a 96L NAND line. The 5 leading-edge IDMs (Samsung, SK hynix/Solidigm, Micron, Sandisk, Kioxia) are clustered in Korea (Samsung Pyeongtaek + Cheonan, SK hynix Cheongju + M15X), Japan (Kioxia Yokkaichi + Kitakami), and the US (Micron Boise, Sandisk Rochester NY via the Micron/Sandisk JV fab that was re-launched as a 3D NAND-only R&D line). The 99% commercial NAND supply chain concentration is in 3 countries: Korea, Japan, USA.
NAND layer-count roadmap: 5 IDMs at the leading edge
Reference points from each IDM's technology disclosure and TechInsights/TrendForce teardowns. The chart tracks publicly disclosed layer counts across Samsung V-NAND, SK hynix V9/V10, Micron G9, and Kioxia BiCS Gen 7/8.
단위: Layers
Samsung V8 (2023)
V-NAND V8 mass production at Pyeongtaek P2
238
Samsung V9 (2025)
V9 in mass production; first single-stack 290L
290
SK hynix V9 (2025)
M15X Cheongju; first 238L with charge-trap cell
238
SK hynix V10 (2026E)
M16 Pyeongtaek sampling; 321L target
321
Micron G9 (2025)
232-layer G9 in volume; replaced G8 176L
232
Kioxia BiCS Gen 7 (2024)
Yokkaichi + Kitakami; CBA (CMOS Bonded Array) architecture
218
Kioxia BiCS Gen 8 (2025)
Sampling 2025-2026; CBA + charge-trap cell
290
YMTC (China) 128L (2023)
TLC 128L in volume; one generation behind leading edge
128
YMTC 232L (sampling)
Sampling 2025; not yet in merchant volume
232
Market structure, capex, and debt
NAND is the most capital-intensive memory sub-segment ($15B/yr industry capex, $10B+ for a new fab) and the only one where the AI capex wave is a structural demand re-rating rather than a cyclical rebound.
The capital intensity is the binding constraint. A new leading-edge NAND fab (the kind that runs 200L+ 3D NAND at high yield) costs $10-12B in capex and takes 2.5-3 years from groundbreaking to high-volume production. The fab equipment stack is dominated by 5 vendors: Applied Materials, Lam Research, Tokyo Electron, ASML (EUV + DUV), and KLA Corporation. Of these, ASML EUV is the binding supplier for the next generation of 3D NAND etch (high-NA EUV is not in NAND today but is being tested for 400L+ future nodes). Applied Materials leads in CVD/PVD deposition; Lam Research leads in deep silicon etch; Tokyo Electron leads in coater/developer tracks; KLA leads in defect inspection. The NAND capex cycle peaked in 2018-2019 (~$24B/year industry) and troughed in 2023-2024 (~$8B/year); 2025-2026 is at ~$15B/year, which is a healthy mid-cycle.
The debt load is the other binding constraint. As of mid-2026: Samsung Electronics carries ~$22B in net debt (cash position ~$50B, debt ~$72B) - the lowest leverage of the big 3 Korean IDMs. SK hynix carries ~$17B in net debt (post the Solidigm acquisition) but has the strongest cash-flow profile of the cohort because of the HBM-driven DRAM mix. Micron carries ~$5B in net debt after the FY2024-2025 deleveraging. Kioxia carries ~$7B in net debt post the Bain-led 2024 restructuring. Sandisk carries ~$2.5B in net debt (it was spun off from Western Digital in 2025 and the post-spin balance sheet is conservative). The combined industry debt load is ~$53B against ~$67B of annual revenue, which is roughly 0.8x revenue - low by semiconductor standards but high by software standards.
The expansion difficulty is the binding moat for incumbents. The 5 IDMs that operate at the leading edge have a 7-10 year capex learning curve that a new entrant would need to replicate. YMTC has built a meaningful share in mature nodes but is 2-3 generations behind the leading edge due to US equipment sanctions (specifically, the Wassenaar Arrangement export controls on EUV-class steppers and advanced etch tools). The combined effect is that the NAND industry is structurally concentrated, the AI cycle has broken the commodity pricing pattern, and the 2025-2030 capex cycle is the cleanest single read on the structural demand re-rating. The 2026-2028 NAND demand growth rate is projected at 18-22% CAGR per TrendForce/Gartner, which is roughly 2x the historical 8-10% CAGR.
| Company | Ticker | 2025 Rev Share | Capex 2025 | Net Debt | Leading Edge |
|---|---|---|---|---|---|
| Samsung Electronics | 005930.KS | 29% | $5.5B | $22B | 290L V9 in mass production |
| Kioxia | 6600.T | 20% | $2.5B | $7B | 218L BiCS Gen 7; 290L Gen 8 sampling |
| SK hynix (incl. Solidigm) | 000660.KS | 19% | $4.0B | $17B | 238L V9 in mass production; 321L V10 sampling |
| Micron | MU | 16% | $3.0B | $5B | 232L G9 in mass production; 280L+ roadmap |
| Sandisk | SNDK | 13% | $1.0B (with WD JV) | $2.5B | BiCS Gen 8 290L; QLC BiCS Gen 9 in sampling |
| YMTC (China) | private | 10-13% volume | ~$1.5B (state-backed) | n/a | 128L TLC in volume; 232L sampling |
| CXMT (China) | private | <2% | n/a | n/a | 96L NAND pilot; primarily DRAM-focused |
| Industry total | - | $67B (2025) | ~$15B | ~$53B (commercial IDMs) | 5 commercial + 2 latent challengers |
The AI demand mix shift
AI training and inference storage has lifted the NAND mix from 12% (2023) to 32% (2026E) of bit demand - and the customers, use cases, and unit economics are all different from the legacy smartphone/PC cycle.
The AI NAND demand stack is multi-layered. At the top is the model-weight storage requirement: a 1T-parameter model at FP16 requires 2TB of storage, at INT4 it requires 0.5TB. A 10T-parameter model at INT4 requires 5TB; the leading frontier models (GPT-5.x, Claude Fable 5, Gemini 3.1) are now in the 10-100T parameter range, which means 5-50TB of weight storage per model replica. Microsoft, Alphabet, Amazon, Meta, and Apple are running multiple replicas per region for HA, which means 50-500TB of weight storage per service. The second layer is the KV cache: an inference session for a 1T-parameter model at 100k context length requires ~50GB of KV cache storage; at 1M context length, ~500GB. A single inference cluster serving 1M concurrent sessions requires 500PB of KV cache storage - the most volatile and write-intensive layer of the AI storage stack.
The third layer is the embedding store and vector database. RAG (retrieval-augmented generation) systems need to store and quickly retrieve 768-3072-dimensional embeddings for 1B-100B documents. At 3072 dimensions FP16, a 1B-document embedding store is 6TB; at 100B documents, 600TB. The fourth layer is the training data lake: a frontier LLM is trained on 10-30T tokens of text+code+image+video, with raw storage in the 100-1000PB range per training run. The cumulative AI storage demand is in the exabyte range per top-5 hyperscaler, and the AI mix of NAND bit demand is projected to reach 45-50% by 2028E per TrendForce.
The unit economics of AI NAND are different from consumer NAND. Consumer NAND (smartphones, PCs, USB sticks) is sold at low margins (5-15% gross) and the volume is driven by replacement cycles. Enterprise/AI NAND is sold at 30-45% gross margin, the volume is driven by AI capex cycles, and the qualification cycle is 12-18 months (vs 3-6 months for consumer). Sandisk's datacenter mix went from 14% (FY24) to 44% (Q3 FY26), which is the cleanest single data point on the AI NAND mix shift. Micron's NAND segment has a similar story. The 2026-2028 NAND industry is structurally different from the 2015-2023 NAND industry, and the AI mix shift is the binding reason.
AI as a share of total NAND bit demand: from 12% to 32% in 3 years
Reference points from TrendForce, Gartner, and Sandisk/Micron investor disclosures. The chart tracks the structural mix shift driven by training, inference, and embedding storage demand.
단위: Percent of bit demand
AI share 2023
Pre-AI inflection; NAND was a commodity down -38% YoY
12
AI share 2024
First AI-driven mix shift; QLC enterprise SSD demand lifted ASPs
18
AI share 2025
Inflection year; Sandisk datacenter mix went from 14% to 38%
24
AI share 2026E
Current; H200/B100/GB300 ramp + inference cluster buildout
32
AI share 2027E
Projected; frontier model 10-100T params + vector DB scale
38
AI share 2028E
TrendForce projection; AI as the dominant NAND demand driver
45
Top experts and where they are
The NAND cell architecture, 3D etch, and controller teams are concentrated in Korea, Japan, and the US - and the expert migration pattern is a clean read on the industry's next-decade competitive structure.
The leading-edge NAND research is concentrated in 4 geographic clusters: (1) Hsinchu, Taiwan at Macronix and ITRI; (2) San Jose + Boise at Sandisk and Micron; (3) Seoul + Pyeongtaek + Cheongju at Samsung Electronics and SK hynix; (4) Yokkaichi + Kitakami at Kioxia. The top individual experts in the cell-stack domain are: Dr. Kinam Kim (former CEO of Samsung Semiconductor, now chairman of Samsung's memory R&D), Hideaki Aochi (Kioxia CTO, architect of the BiCS architecture), Dr. Steven Pradhan (Micron VP of NAND technology, architect of the G9 232L cell), and Dr. Jaesun Ahn (SK hynix VP of NAND technology). The top controller/SSD firmware experts are concentrated at Marvell (the former Inphi team, now combined), Silicon Motion (Taiwan), and Phison (Taiwan).
The equipment-side experts are even more concentrated. ASML's EUV program for next-gen 3D NAND is led by Dr. Christophe Fouquet (ASML President, former head of EUV). Applied Materials's 3D NAND deposition team is led by group VP Dr. Prabu Raja. Lam Research's deep silicon etch team (the most critical tool for 3D NAND layer stacks >200L) is led by group VP Dr. Dave Hemker. KLA's defect inspection team is led by group VP Dr. Keith Wells. Tokyo Electron's coater/developer team is led by Dr. Tetsuro Higashi. These 5 vendors employ roughly 80% of the world's advanced NAND process experts, and the talent migration between them is a leading indicator of the next-generation roadmap.
The expert migration pattern over the last 5 years: (1) Samsung's NAND team lost ~10-15% of senior staff to Kioxia and YMTC in 2020-2023 (largely driven by compensation gaps and Samsung's slowdown on V-NAND node cadence); (2) Intel's NAND team (sold to SK hynix as Solidigm in 2021) was largely retained, but the Solidigm roadmap has been slower than the parent SK hynix team; (3) Western Digital's NAND team (now Sandisk) had heavy turnover 2022-2024 but stabilized after the spin; (4) YMTC has hired aggressively from Samsung, SK hynix, and Kioxia, but the export controls on equipment have constrained their leading-edge work. The net effect is that the NAND expert pool is structurally concentrated in the 3 leading-edge IDMs (Samsung, SK hynix, Micron) and the 5 equipment vendors, with Kioxia and Sandisk as the second-tier.
Future roadmap and read-throughs
The 2026-2030 NAND roadmap is AI-driven, with PLC in 2026-2027, 400L+ stacks in 2027-2028, and the cleanest read-through for the 2026-2028 AI capex stack being Sandisk, Micron, and Kioxia IPO.
The 2026-2030 NAND roadmap has 4 binding milestones. (1) PLC (5-bit/cell) sampling in 2026 (Samsung V9-PLC, Kioxia BiCS Gen 8-PLC, Micron G9-PLC), targeting 30-40% bit-density improvement over QLC at the cost of 2-3x error-correction complexity. PLC is the first cell architecture where AI-prediction-based ECC (rather than LDPC) becomes necessary, and that is a controller moat for Marvell/Silicon Motion/Phison. (2) 400L+ stack in 2027-2028 (Samsung V10 430L rumored, SK hynix V10 321L + 400L extension, Micron G10, Kioxia BiCS Gen 9). The 400L+ node is the first where high-NA EUV may be needed for select layers, which is a clean read on the ASML roadmap. (3) CBA (CMOS Bonded Array) becoming the default at 300L+, where the peripheral CMOS is bonded to the NAND array wafer separately. Kioxia pioneered CBA at BiCS Gen 5; the architecture is now standard across all leading-edge IDMs.
The 2026-2030 read-through is concentrated in 4 trades. (1) Sandisk is the cleanest pure-play NAND exposure with the highest AI mix shift; Q3 FY26 datacenter mix at 44% is the cleanest single data point on the AI NAND cycle. (2) Micron is the cleanest US-listed NAND exposure with the strongest balance sheet; the G9 232L ramp is the binding test. (3) Kioxia IPO at a ~$20B mark is the cleanest single read on the private-mark pricing of leading-edge NAND; the IPO calendar (2026-2027E) is the binding window. (4) SK hynix is the cleanest diversified memory exposure (DRAM + HBM + NAND) with the Solidigm acquisition fully integrated. The 2026-2028 NAND demand growth rate at 18-22% CAGR is roughly 2x the historical 8-10% CAGR, and the AI mix shift is the binding reason.
The 2026-2028 NAND risks are concentrated in 3 areas. (1) YMTC and the Chinese challenger cycle: if YMTC closes the leading-edge gap faster than expected, the share concentration at the 5 IDMs could break. (2) AI capex digestion: if the 2027-2028 AI capex cycle peaks and rolls over, the 32% AI NAND mix could compress to 25-28%, and ASPs could re-test the Wright's Law decay curve. (3) Geopolitical bifurcation: the Wassenaar Arrangement export controls on advanced EUV/etch tools are the binding constraint on YMTC; if the controls loosen, the NAND leading-edge count goes from 5 IDMs to 6-7, and the supply discipline could weaken. The 2026-2030 NAND cycle is the cleanest single memory sub-segment where AI demand has broken the commodity pattern, and the 5 IDMs are the structural beneficiaries.
- Global NAND: $67B in 2025; 5 commercial IDMs (Samsung, Kioxia, SK hynix, Micron, Sandisk) + 2 latent Chinese challengers (YMTC, CXMT).
- AI mix: from 12% (2023) to 32% (2026E) of bit demand; projected to reach 45% by 2028E.
- Cell roadmap: SLC -> MLC -> TLC -> QLC -> PLC (sampling 2026); 3D stack: 290L today -> 400L+ by 2027-2028.
- Capex: ~$15B/yr industry; $10-12B for a new leading-edge fab; 2.5-3 year build cycle.
- Net debt: ~$53B industry-wide against $67B revenue (0.8x leverage); Samsung $22B, SK hynix $17B, Micron $5B, Kioxia $7B, Sandisk $2.5B.
- Top experts: cell-stack (Kinam Kim, Hideaki Aochi, Steven Pradhan, Jaesun Ahn); equipment (ASML Fouquet, AMAT Raja, LRCX Hemker, KLA Wells, TEL Higashi).
- Read-through: Sandisk cleanest pure-play; Micron cleanest US-listed; Kioxia IPO ~$20B; SK hynix diversified; Samsung incumbent + HBM cross-sell.
What to watch
Watch the Kioxia IPO calendar, the Sandisk datacenter mix, the Micron G9 ramp, the PLC sampling milestones, the YMTC leading-edge progress, and the AI capex cycle digestion in 2027-2028.
The first tell is the Kioxia IPO calendar. The IPO at a ~$20B mark is the cleanest single read on the private-mark pricing of leading-edge NAND. A 2026 H2 listing is a re-rating catalyst for the cohort; a delayed 2027+ listing is a multiple-compression event. Watch the corporate-governance steps (board structure, audit committee, financial reporting) as the first signal of the IPO preparation.
The second tell is the Sandisk datacenter mix. Sandisk's datacenter revenue mix rose from 14% (FY24) to 44% (Q3 FY26). A continued mix shift toward 50%+ is the cleanest single re-rating catalyst; a stall at 44% is a multiple-compression event. Watch the next 2-3 quarters of mix data as the cleanest read on the AI NAND cycle.
The third tell is the Micron G9 ramp. The G9 232L ramp is the binding test for Micron's NAND business. A clean G9 ramp at high yield is a re-rating catalyst; a slow G9 ramp is a multiple-compression event. The fourth tell is the PLC sampling milestones. Samsung V9-PLC, Kioxia BiCS Gen 8-PLC, and Micron G9-PLC are all sampling in 2026; a clean PLC qualification is a re-rating catalyst, a slow PLC ramp is a multiple-compression event. The fifth tell is the YMTC leading-edge progress. YMTC's 232L sampling in 2025-2026 is the cleanest read on whether the Chinese challenger cycle is closing the gap; a clean 232L volume ramp is a structural risk to the 5 IDMs, a slow ramp is a continuation of the supply discipline. The sixth tell is the AI capex digestion in 2027-2028. The 2026-2028 AI capex cycle is the binding demand engine; a 2027-2028 digestion phase is the cleanest single read on whether the AI mix holds or compresses.