
%22%2F%3E%0A%20%20%3Ccircle%20cx%3D%22220%22%20cy%3D%22150%22%20r%3D%22180%22%20fill%3D%22%2322d3ee%22%20fill-opacity%3D%220.12%22%2F%3E%0A%20%20%3Ccircle%20cx%3D%221010%22%20cy%3D%22130%22%20r%3D%22220%22%20fill%3D%22%2338bdf8%22%20fill-opacity%3D%220.08%22%2F%3E%0A%20%20%3Ccircle%20cx%3D%22920%22%20cy%3D%22520%22%20r%3D%22170%22%20fill%3D%22%2322d3ee%22%20fill-opacity%3D%220.06%22%2F%3E%0A%20%20%3Cpath%20d%3D%22M140%20430h920%22%20stroke%3D%22url(%23line)%22%20stroke-width%3D%2212%22%20stroke-linecap%3D%22round%22%2F%3E%0A%20%20%3Cpath%20d%3D%22M220%20360c120-150%20260-220%20380-220s260%2070%20380%20220%22%20fill%3D%22none%22%20stroke%3D%22%2367e8f9%22%20stroke-opacity%3D%220.5%22%20stroke-width%3D%2216%22%20stroke-linecap%3D%22round%22%20stroke-linejoin%3D%22round%22%2F%3E%0A%20%20%3Cpath%20d%3D%22M300%20398h600%22%20stroke%3D%22%2394a3b8%22%20stroke-opacity%3D%220.24%22%20stroke-width%3D%228%22%20stroke-linecap%3D%22round%22%2F%3E%0A%20%20%3Ctext%20x%3D%22220%22%20y%3D%22510%22%20fill%3D%22%23e2e8f0%22%20fill-opacity%3D%220.7%22%20font-family%3D%22Arial%2C%20Helvetica%2C%20sans-serif%22%20font-size%3D%2238%22%20letter-spacing%3D%228%22%3EINSIGHTS%3C%2Ftext%3E%0A%3C%2Fsvg%3E)
Industry structure
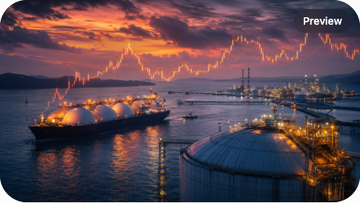
LNG is a $400B/year global trade - QatarEnergy leads with ~25% share, Cheniere Energy is the largest US exporter at ~15%, the US is the #1 LNG exporter by 2026, and Asia (China + Japan + Korea + India) is ~70% of demand.
LNG (Liquefied Natural Gas) is a $400B/year global trade in 2025 (~410 MT total volume, up from ~370 MT in 2024), and it has become the binding flexible-supply leg of the global energy transition. The 5 largest LNG suppliers are QatarEnergy (~25% global LNG export share, 78 MTPA in 2025, expanding to 126 MTPA by 2027 with the North Field expansion), Cheniere Energy (~15%, the largest US LNG exporter at ~45 MTPA across Sabine Pass + Corpus Christi, expanding to ~60 MTPA by 2027), Shell (~10%, the largest IOC LNG portfolio at ~35 MTPA across Australia + Trinidad + Qatar + Prelude FLNG), TotalEnergies (~8%, ~30 MTPA across Qatar + Australia + Mozambique + US Gulf), and Woodside Energy (~5%, ~17 MTPA at Pluto + Browse + Wheatstone). The 5 suppliers are ~63% of global LNG supply, with the remaining 37% split across Petronas (Malaysia), BP (Trinidad + Indonesia), Equinor (Norway + Tanzania), Novatek (Russia), and a long tail of US Gulf + African + Asian producers.
The demand side is structurally concentrated in Asia. China is the #1 LNG importer at ~95 MTPA in 2025 (~23% of global demand), Japan is #2 at ~75 MTPA (~18%), Korea is #3 at ~50 MTPA (~12%), India is #4 at ~35 MTPA (~9%), and Taiwan + Thailand + other Asia are another ~25 MTPA (~6%). The Asian demand is ~70% of global LNG, and the European demand (rebuilt after the 2022 Ukraine invasion) is ~20% (~85 MTPA in 2025). The US is the only country that is simultaneously the #1 LNG exporter (by 2026) and a relatively small LNG importer (~3 MTPA in 2025, primarily at the Everett + Cove Point regasification terminals).
The 2025-2030 LNG supply-demand is structurally tight. The demand is projected to grow from ~410 MT in 2025 to ~500 MT by 2028E and ~580 MT by 2030E, driven by: (1) China's coal-to-gas switching (cleaner air + decarbonization); (2) Korea + Japan's nuclear phase-out + restart uncertainty; (3) Europe's continued displacement of Russian pipeline gas; (4) India's clean energy transition; (5) Southeast Asia (Vietnam, Philippines, Thailand, Indonesia, Bangladesh) entering the LNG market. The supply is projected to grow from ~410 MT in 2025 to ~520 MT by 2028E and ~620 MT by 2030E, driven by: (1) the US Gulf expansion (Cheniere Stage 3 + Plaquemines + Rio Grande LNG + CP2 LNG + Port Arthur LNG + Golden Pass); (2) the Qatar North Field expansion (QatarEnergy + TotalEnergies + Shell + ConocoPhillips + ExxonMobil); (3) the Mozambique + Tanzania LNG restart; (4) the Canada LNG Canada Phase 2 + Woodfibre LNG. The 2026-2030 supply-demand balance is projected to be ~20-40 MT short in any given year, which is the binding reason the JKM Asian LNG spot price has held at $10-15/MMBtu in 2025-2026 (vs $5-8/MMBtu in 2019-2020).
The LNG technology stack
LNG is built on 5 binding layers: gas field production, gas processing (acid gas removal + dehydration), liquefaction (the binding technology), LNG storage (cryogenic tanks), and LNG transport (specialized LNG carriers) - each is a 5+ year R&D + capex moat.
LNG technology is built on 5 binding layers. (1) Gas field production: the natural gas is produced from conventional + unconventional (shale + tight + coalbed methane) gas fields. The gas field production technology is dominated by ExxonMobil, Shell, Chevron, ConocoPhillips, Equinor, Saudi Aramco, QatarEnergy, Petronas, and a long tail of national oil companies. The gas field production capex is ~$5-10B per 5 MTPA LNG project, which is the cleanest single read on the upstream leg of the LNG supply chain. (2) Gas processing: the produced gas is processed to remove acid gases (H2S, CO2) + water (dehydration) + NGLs (natural gas liquids) before liquefaction. The gas processing technology is dominated by Honeywell UOP, Schneider Electric, Linde, and Air Products. The gas processing capex is ~$1-2B per 5 MTPA LNG project.
(3) Liquefaction: the liquefaction technology is the binding constraint of the LNG supply chain. The 3 leading-edge liquefaction technologies are: (a) ConocoPhillips Optimized Cascade (the original LNG technology, used at ~30% of global LNG capacity); (b) Air Products AP-C3MR (mixed refrigerant, used at ~40% of global LNG capacity, the cleanest mid-scale); (c) Air Products AP-X (the largest single-train, used at QatarEnergy mega-trains, the cleanest large-scale). The liquefaction technology is dominated by Air Products (the cleanest supplier, ~50% global share), ConocoPhillips (~25% share), Black & Veatch (~15% share via the PRICO technology), and Linde (~10% share via the LIMUM technology). The liquefaction capex is ~$3-5B per 5 MTPA LNG project, and the liquefaction cycle is 3-5 years from FID to first cargo. (4) LNG storage: the LNG is stored in cryogenic tanks at the export terminal at -162°C. The LNG storage technology is dominated by Chart Industries, Air Water, and Mitsubishi Heavy Industries (the largest LNG tank supplier).
(5) LNG transport: the LNG is transported in specialized LNG carriers (typically 165,000-180,000 cubic meter capacity, the Q-Max size used at QatarEnergy mega-trains is 266,000 cubic meters). The LNG carrier orderbook reached 500+ vessels in 2025-2026 (vs ~700 in-service fleet), and the 2026-2028 deliveries will add 30%+ capacity. The LNG carrier technology is dominated by HD Hyundai Heavy Industries, Samsung Heavy Industries, Hanwha Ocean (the 3 Korean shipbuilders, ~70% global LNG carrier market share), and Daewoo Shipbuilding & Marine Engineering (now Hanwha Ocean, ~20% share). The LNG carrier newbuild price is ~$250-280M per vessel in 2025-2026 (vs $180-200M in 2020-2021), and the 2026-2028 LNG carrier capacity is the cleanest single read on the LNG shipping cycle.
LNG liquefaction technology share: Air Products AP-C3MR 40% + ConocoPhillips Optimized Cascade 30%
Reference points from IGU (International Gas Union), Wood Mackenzie, and the LNG technology suppliers' IR disclosures. The chart tracks the global LNG liquefaction technology market share.
단위: Percent / MT per year
Air Products AP-C3MR (%)
Mixed refrigerant; mid-scale; cleanest mid-scale tech
40
ConocoPhillips Optimized Cascade (%)
Original LNG tech; 3 refrigerant loops; cleanest small-mid
30
Air Products AP-X / AP-DUAL (%)
Mega-train; QatarEnergy + US Gulf; cleanest large-scale
15
Black & Veatch PRICO (%)
Single mixed refrigerant; FLNG + small-scale; cleanest FLNG
10
Linde LIMUM (%)
Mixed refrigerant; small-mid scale
5
LNG market 2025 (MT)
~$400B; up from ~370 MT in 2024
410
LNG market 2028E (MT)
Asia + Europe + emerging Asia
500
LNG market 2030E (MT)
Coal-to-gas + Russia displacement + SE Asia
580
The 5 LNG supplier oligopoly
QatarEnergy leads with ~25% share + North Field expansion, Cheniere Energy is the largest US exporter at ~15%, Shell is the largest IOC at ~10%, TotalEnergies is at ~8%, and Woodside is the largest Australian at ~5%.
QatarEnergy is the largest LNG supplier with ~25% global share and the most aggressive expansion plan. QatarEnergy's existing LNG capacity is ~78 MTPA (from the North Field + the Qatargas + RasGas trains, consolidated under QatarEnergy in 2017-2018). The North Field expansion is the largest single LNG project in the world: 49 MTPA of new capacity in 4 phases (North Field East + North Field South), with the first phase (32 MTPA) coming online in 2026-2027 and the second phase (17 MTPA) coming online in 2027-2028. The North Field expansion partners include TotalEnergies (the largest IOC partner at ~9.4 MTPA equity), Shell (~7.5 MTPA), ConocoPhillips (~6 MTPA), ExxonMobil (~6 MTPA), Eni (~5 MTPA), Sinopec (~5 MTPA), CNOOC (~5 MTPA), and CNPC (~5 MTPA). The total North Field expansion capex is ~$50B over 2024-2028, and the total Qatar LNG capex is ~$200B over 2024-2030.
Cheniere Energy is the largest US LNG exporter with ~15% global share, dominating the US Gulf LNG export market. Cheniere's existing LNG capacity is ~45 MTPA (Sabine Pass 6 trains + Corpus Christi 3 trains, with the Corpus Christi Stage 3 expansion adding 7 more trains). The Cheniere expansion plan is to add ~15 MTPA of new capacity at Sabine Pass + Corpus Christi by 2027-2028, bringing total capacity to ~60 MTPA. Cheniere's LNG business is a pure-play (no upstream gas production, no refining), and the Cheniere LNG long-term contract book is ~90% of capacity locked in at oil-indexed pricing through 2028-2032. The Cheniere capex 2025-2030 is ~$25-30B, and the Cheniere dividend + buyback yield is ~3-4%.
Shell is the largest IOC LNG portfolio at ~10% global share, with LNG capacity ~35 MTPA across Australia (Prelude FLNG + QGC + Gorgon), Trinidad (Atlantic LNG), Qatar (QatarEnergy partner), and other (Nigeria LNG, Brunei LNG). The Shell LNG strategy is integrated upstream + midstream + downstream, and the Shell LNG long-term contract book is ~70% of capacity locked in. TotalEnergies is at ~8% global share with ~30 MTPA across Qatar (the largest IOC partner in QatarEnergy), Australia (Ichthys + Gladstone), Mozambique (the restart), and US Gulf (Cameron LNG). Woodside Energy is the largest Australian LNG exporter at ~5% global share with ~17 MTPA at Pluto + Browse + Wheatstone + the planned Browse + Sunrise developments.
| Supplier | Ticker | Share 2025 | Capacity 2025 | Capacity 2027E | Leading Project |
|---|---|---|---|---|---|
| QatarEnergy | private | ~25% | 78 MTPA | 126 MTPA | North Field East + South expansion |
| Cheniere Energy | LNG | ~15% | 45 MTPA | 60 MTPA | Sabine Pass + Corpus Christi expansion |
| Shell | SHEL | ~10% | 35 MTPA | 40 MTPA | Australia + Trinidad + Qatar + Prelude FLNG |
| TotalEnergies | TTE | ~8% | 30 MTPA | 38 MTPA | Qatar + Australia + Mozambique + US Gulf |
| Woodside Energy | WPL.AX | ~5% | 17 MTPA | 20 MTPA | Pluto + Browse + Wheatstone + Sunrise |
| Petronas | private | ~5% | 28 MTPA | 32 MTPA | Malaysia LNG + PFLNG Dua |
| BP | BP | ~4% | 18 MTPA | 20 MTPA | Trinidad + Indonesia + LNG Canada (5%) |
| Equinor | EQNR | ~3% | 14 MTPA | 16 MTPA | Norway Hammerfest + Tanzania LNG |
| Novatek (Russia) | private | ~5% | 20 MTPA | 25 MTPA | Yamal LNG + Arctic LNG 2 (sanctioned) |
| Other US Gulf | - | ~15% | 50 MTPA | 80 MTPA | Plaquemines + Rio Grande + CP2 + Port Arthur + Golden Pass |
| Other (Africa + Asia + Canada) | - | ~5% | 75 MTPA | 63 MTPA | Mozambique + Tanzania + LNG Canada + others |
| Total global LNG | - | 100% | 410 MT (2025) | 520 MT (2028E) | ~$400B 2025 / ~$520B 2028E |
LNG demand, customers, and the energy transition
Asia is ~70% of LNG demand (China Petroleum + CNPC + Sinopec + CNOOC + JERA + KOGAS + India's GAIL), the 2026-2030 supply is ~20-40 MT short in any given year, and the JKM Asian LNG spot price is the cleanest single read.
The LNG customer base is structurally concentrated in state-owned utilities and the 4 largest Asian LNG importers: China is the #1 LNG importer at ~95 MTPA in 2025 (~23% of global demand), with China National Petroleum Corporation (CNPC) (the largest Chinese LNG buyer at ~30 MTPA), Sinopec (~25 MTPA), CNOOC (~20 MTPA), and ENN Energy (~5 MTPA) as the cleanest single exposures. Japan is #2 at ~75 MTPA (~18%), with JERA (~30 MTPA, the largest Japanese LNG buyer, the JV of Tokyo Electric + Chubu Electric) and Tokyo Gas (~15 MTPA) and Osaka Gas (~10 MTPA) as the cleanest Japanese exposures. Korea is #3 at ~50 MTPA (~12%), with KOGAS (the Korean state-owned LNG monopoly, ~50 MTPA) as the cleanest single Korean exposure. India is #4 at ~35 MTPA (~9%), with GAIL (India) (~15 MTPA), Indian Oil (~10 MTPA), and Petronet LNG (~10 MTPA) as the cleanest Indian exposures.
The 2026-2030 LNG supply-demand is projected to be ~20-40 MT short in any given year, which is the binding reason the JKM Asian LNG spot price has held at $10-15/MMBtu in 2025-2026 (vs $5-8/MMBtu in 2019-2020). The demand side is growing at ~7% CAGR (from 410 MT in 2025 to ~580 MT by 2030E), driven by: (1) China's coal-to-gas switching (cleaner air + decarbonization); (2) Korea + Japan's nuclear phase-out + restart uncertainty; (3) Europe's continued displacement of Russian pipeline gas; (4) India's clean energy transition; (5) Southeast Asia (Vietnam, Philippines, Thailand, Indonesia, Bangladesh) entering the LNG market. The supply side is growing at ~6% CAGR (from 410 MT in 2025 to ~620 MT by 2030E), driven by: (1) the US Gulf expansion; (2) the Qatar North Field expansion; (3) the Mozambique + Tanzania LNG restart; (4) the Canada LNG Canada Phase 2 + Woodfibre LNG.
The 2026-2030 LNG price trajectory is the cleanest single read on the energy transition. The JKM Asian LNG spot price is projected at $10-15/MMBtu in 2026-2028 (vs $5-8/MMBtu in 2019-2020), with the European TTF price at $9-13/MMBtu and the US Henry Hub at $3-4/MMBtu. The 2026-2028 LNG spread (JKM - Henry Hub) is projected at $6-12/MMBtu, which is the cleanest single read on the LNG export margin. The 2026-2030 LNG read-through is the cleanest single exposure to the global energy transition, and the LNG supply-demand is the binding reason.
Global LNG demand 2025: Asia 70% (China 23% + Japan 18% + Korea 12% + India 9%)
Reference points from IGU (International Gas Union), Wood Mackenzie, and the LNG importers' IR disclosures. The chart tracks the structural concentration of LNG demand by country.
단위: Percent / USD per MMBtu
China 2025 (%)
CNPC + Sinopec + CNOOC + ENN
23
Japan 2025 (%)
JERA + Tokyo Gas + Osaka Gas
18
Korea 2025 (%)
KOGAS monopoly
12
India 2025 (%)
GAIL + Indian Oil + Petronet LNG
9
Other Asia 2025 (%)
Taiwan, Thailand, others
6
Europe 2025 (%)
Replacing Russian pipeline gas
20
Middle East + Americas 2025 (%)
Re-export, bunkering, others
12
JKM Asian LNG 2025 ($/MMBtu)
vs $5-8/MMBtu 2019-2020
12
Top experts, expansion, and read-throughs
LNG experts are concentrated at QatarEnergy (Doha), Cheniere (Houston), and Air Products (Allentown) - and the 2026-2030 LNG capex is the cleanest single read on the energy transition's flexible-supply leg.
The LNG expert pool is structurally concentrated in 3 hubs. At QatarEnergy, the top LNG experts are: CEO Saad al-Kaabi, Head of LNG Expansion HE Minister of Energy, and the QatarEnergy LNG project management team. At Cheniere Energy, the top LNG experts are: CEO Jack Fusco, COO Anatol Feygin, and Head of Project Development Scott Davis. At Air Products, the top LNG experts are: CEO Seifi Ghasemi, Head of LNG Technology Dr. Samir Serhan, and Head of LNG Equipment Dr. Brian Galonek. The 5-hub expert pool is ~5,000 engineers, and the geographic concentration is in Doha (QatarEnergy) + Houston (Cheniere + the 5 US Gulf developers) + Allentown (Air Products) + London (Shell LNG) + Paris (TotalEnergies LNG).
The 2026-2030 LNG capex is the cleanest single read on the energy transition's flexible-supply leg. The total LNG industry capex 2025-2030 is ~$600B+ (US projects $200B, Qatar $200B, US Gulf expansion $100B, Mozambique/PNG $50B, others $50B). The capex is concentrated at the 5 leading-edge suppliers + the 5 second-tier + the 10+ smaller. The US is the cleanest single geographic exposure (~$200B in 2025-2030 capex), Qatar is the second (~$200B), and the other regions are ~$200B combined. The 2026-2030 LNG capex is the binding reason the LNG carrier orderbook reached 500+ vessels and the LNG shipping cycle is at the cleanest single inflection.
The 2026-2030 LNG read-through is concentrated in 5 trades. (1) Cheniere Energy is the cleanest US LNG pure-play with the largest US LNG export capacity; the Sabine Pass + Corpus Christi expansion is the binding test. (2) Shell is the cleanest IOC LNG exposure with the most diversified LNG portfolio; the integrated upstream + midstream + downstream is the binding advantage. (3) TotalEnergies is the cleanest European LNG exposure with the largest Qatar partner stake; the Mozambique restart is the binding test. (4) Woodside Energy is the cleanest Australian LNG exposure; the Browse + Sunrise developments are the binding test. (5) KOGAS is the cleanest Korean LNG monopoly exposure; the long-term contract book is the binding advantage. The 2026-2030 LNG demand at ~7% CAGR is the cleanest single read on the energy transition's flexible-supply leg.
- LNG market: ~$400B in 2025 (~410 MT); projected ~$520B by 2028E and ~$700B by 2030E (~7% CAGR); 5-supplier oligopoly (Qatar 25%, Cheniere 15%, Shell 10%, Total 8%, Woodside 5%).
- US is #1 LNG exporter by 2026E (~140 MTPA); Qatar is #2 (~126 MTPA by 2027E); Australia is #3 (~85 MTPA).
- Liquefaction technology: Air Products AP-C3MR 40% + ConocoPhillips Optimized Cascade 30% + Air Products AP-X/Black & Veatch PRICO/Linde LIMUM 30%.
- Customer base: Asia ~70% (China 23% + Japan 18% + Korea 12% + India 9%); Europe ~20% (replacing Russian pipeline gas).
- LNG carrier orderbook: 500+ vessels (vs ~700 in-service); 2026-2028 deliveries add 30%+ capacity; newbuild price ~$250-280M per vessel.
- Capex 2025-2030: $600B+ industry; US $200B + Qatar $200B + US Gulf expansion $100B + others $100B.
- Top experts: QatarEnergy al-Kaabi; Cheniere Fusco, Feygin; Air Products Serhan, Galonek; Shell + TotalEnergies LNG teams.
- Read-through: Cheniere cleanest US pure-play; Shell cleanest IOC; TotalEnergies cleanest European; Woodside cleanest Australian; KOGAS cleanest Korean monopoly.
What to watch
Watch the Qatar North Field East first cargo, the Cheniere Corpus Christi Stage 3, the JKM Asian LNG spot price, the LNG carrier newbuild price, the European TTF, and the Chinese LNG import growth.
The first tell is the QatarEnergy North Field East first cargo. The first North Field East cargo is expected in 2026 H2, and a clean on-time first cargo is a re-rating catalyst for the LNG market; a delay is a multiple-compression event. Watch the corporate disclosures as the cleanest single read on the Qatar LNG ramp.
The second tell is the Cheniere Energy Corpus Christi Stage 3 first cargo. The Corpus Christi Stage 3 is adding 7 more trains (~13.5 MTPA), and the first train is expected to come online in 2026 H2. A clean on-time first cargo is a re-rating catalyst for Cheniere; a delay is a multiple-compression event. The third tell is the JKM Asian LNG spot price. The JKM spot price at $10-15/MMBtu in 2025-2026 is the cleanest single read on the LNG market; a price above $15/MMBtu is a re-rating catalyst for the LNG cohort, a price below $8/MMBtu is a multiple-compression event. The fourth tell is the LNG carrier newbuild price. The newbuild price at $250-280M per vessel in 2025-2026 is the cleanest single read on the LNG shipping cycle; a price above $300M is a re-rating catalyst for the shipbuilders, a price below $220M is a multiple-compression event. The fifth tell is the European TTF price. The TTF price at $9-13/MMBtu in 2025-2026 is the cleanest single read on the European gas demand; a price above $15/MMBtu is a re-rating catalyst for the LNG market, a price below $7/MMBtu is a multiple-compression event. The sixth tell is the Chinese LNG import growth. China's LNG import at ~95 MTPA in 2025 (+15% YoY) is the cleanest single read on the Asian demand; a continued 10%+ growth is a re-rating catalyst for the LNG market, a growth stall at <5% is a multiple-compression event.